 By Michael J. Dinn, CRE® By Michael J. Dinn, CRE®President | Dinn Focused Marketing, Inc. |
In February of this year, Oregon became the first state to pass state-wide rent control laws. California followed in September after rent control was expanded in New York City earlier in the year. Going forward, another dozen states have rent control measures teed up for ballot initiatives. Why has rent control become so popular? Nationally more than half of all renters are paying 30% or more of their gross income on rent – and affordability is worse in large, high-growth cities.
Dinn Focused Marketing and Eigen 10 Advisors, two CRE® consulting firms, joined with two noted academics from Hoyt Advisory Services this year to serve the National Apartment Association’s need to better understand the regulatory environment around creating new multifamily housing. Earlier in the year, Chicago was hosting the NAA Government Affairs Roundtable conference and the audience was over 100 executives. I was fielding questions that all focused on legislative advocacy and several of our attendees mentioned the Wharton Residential Land Use Regulatory Index (WRLUR) which was now over ten years old. Clearly, there was advocacy value in a measure of local development issues and their restrictions. “We have your leadership in most every metro market. Let’s create our own measure, a genuine rental restrictions Index.”
The scope of the project was to compile a comprehensive survey of multifamily development issues, from land and constructions costs to environmental and affordable housing restrictions. Unlike the 2007 WRLUR Index of 15 questions mailed to over 6,000 civic managers, our survey would be directed toward select developers, planners and housing leaders using a powerful online survey platform. The NAA put us in touch with their metro executives while we chose four “pilot” metros to test the approach: Austin, Miami, New York and San Diego. With good feedback and a few adjustments, the survey was launched toward another 25 metro markets selected by the NAA. Within weeks, we had created the NAA-sponsored Barriers to Apartment Construction Index survey. We also enlisted the American Planning Association leadership for survey feedback and dissemination. For select metro markets like Seattle and Philadelphia, I reached out to local Counselors for their contacts and support. The final survey was over 90 questions, detailed but cleverly quick and took another six months to complete. Results were compiled and sorted with a constant emphasis on quality responses and statistical significance. The ten categories of restriction were:
- Community Involvement
- Land and Constructions Costs
- Land Availability
- Infrastructure Constraints
- Affordable Housing Requirements
- Density and/or Growth Restrictions
- Environmental Restrictions
- Zoning Entitlement Process
- Zoning Approval Timeline and
- Local Political Complexity
For an example, under Community Involvement, the survey questions ranged from:
- Rate the importance (1=not present to 4=very important) of citizen opposition to growth.
- Can public votes be used to circumvent a council or planning commission vote?
- Is a community meeting required before any change of zoning request is presented?
- Is it required that a zoning request be put to a popular vote at an open town meeting?
- How frequently (never to very) are citizen lawsuits filed to delay or halt the process?
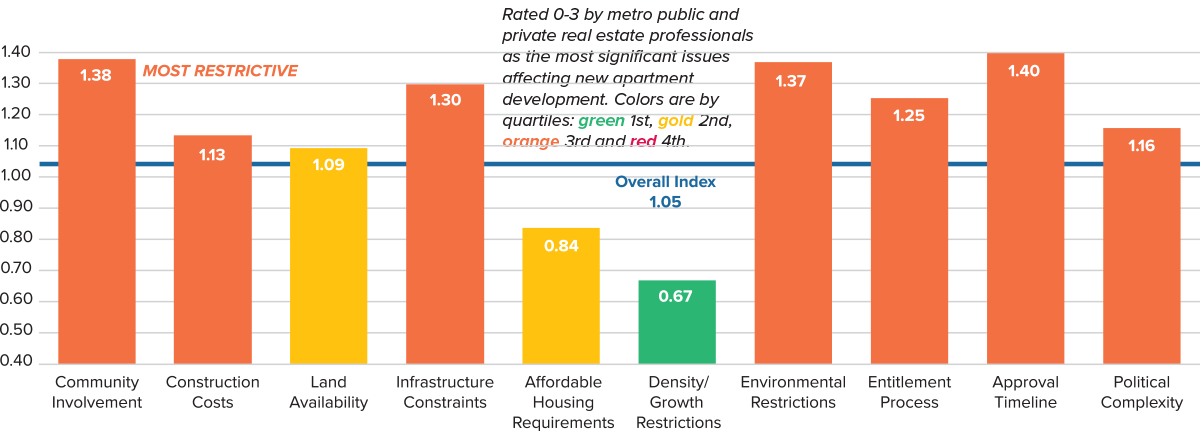
The initial results were distilled into a simple, one-page Metro Summary of graphical metrics, as seen below for Charlotte, North Carolina. Combining private and public sector responses, this younger, vibrant market noted that Approval Timelines, Environmental Restrictions, Community Involvement and Infrastructure Constraints were the most restrictive. We note that these four categories are impacted by policy, but changes to infrastructure are the slowest to implement. Interestingly, Affordable Housing and Density and/or Growth Restrictions were rated the lowest. Charlotte’s overall index was 1.05, ranked 33 among 58 metros.
Barriers to Apartment Construction Subindices in Charlotte, NC

Metro Charlotte Summary Excerpt: The full report including survey design, methodologies and 28 other major metros can be accessed at https://www.naahq.org/news-publications/barriers-apartment-construction-index.
We included key advocacy metrics for Charlotte such as 61,700 new rental units needed by 2030, a 40% high-rent burden, a low 18% of rental units in lower quality, smaller rentals (see our STAR definition) and that their median rental household income of $40,470 was just below the $43,840 needed to meet the average metro rents at 30% of household income.
Early metro executive feedback was very positive. Each Summary and its back story became a narrative tool for local initiatives and regulatory debates. Results were discussed in national circles, including the Secretary of HUD. Not surprisingly, we reaffirmed that the array of development issues varied greatly at the metro level; each metro was distinctive by age, size, land availability and household capacities. For example, the older Boston metro has several submarkets within its MSA and Suffolk County is vastly more complex in restrictions than neighboring Middlesex County. The younger Austin metro indexed higher in restrained growth concerns such as environmental and density issues as well as high fixed costs that limit the development of small properties. And San Diego, well, they just don’t want to see any more apartments – with high ratings across all ten categories.
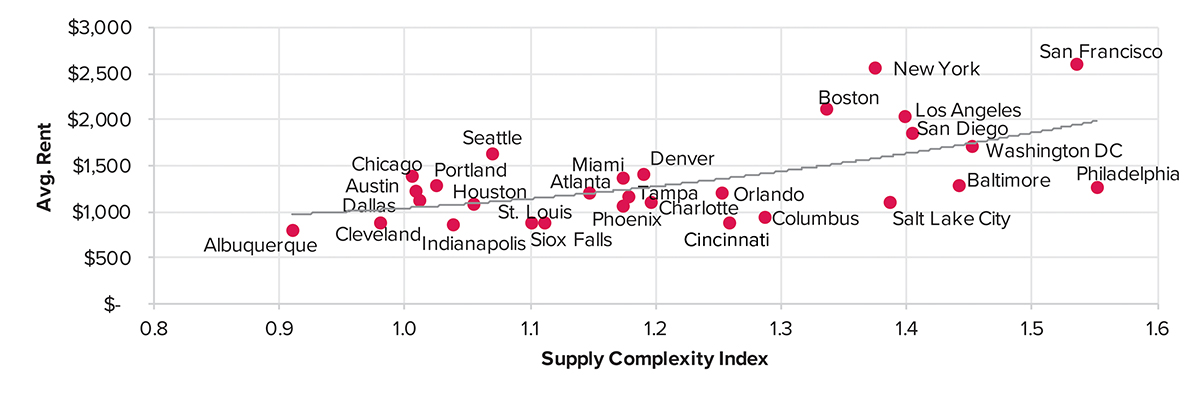
Nationally, we note significant correlation between higher rents and complex regulatory markets that increase uncertainty, time and costs, limiting the ability to deliver more affordable rental housing as seen in the graph below.
Rents Higher in Markets with Higher Complexity Scores

These are only initial results, a first trial. Our survey architecture and growing response network remain in place to further serve these and other local metro discussions. The goal of the project was and remains to provide solid metrics and action priorities for productive rental housing affordability discussions. •


