 Photo: Trong Nguyen/Shutterstock.com
U.S. home prices and rents are experiencing unprecedented growth this year. Although there are several reasons for this surge, the key cause is a prolonged housing supply shortage that has hit a record last year and continues to deepen. New residential construction is starting to catch up nationally but is still far from reducing the shortage and, until then, upward pressure on housing costs will likely persist. Considering that housing rents (rent of primary residence and owner’s equivalent rent) account for over thirty percent of the consumer price index, the trend is also contributing to rising inflation.
To evaluate opportunities as well as risks stemming from this situation, it helps to understand not only the aggregate housing shortage but how it is distributed across market segments, property sub-types, intended tenure (for sale vs. for rent), and geographic areas. While the data that is available for such an analysis is far from perfect, the Housing Vacancy Survey (HVS) that has been conducted by the U.S. Census Bureau for decades is still the only source that helps shed some light on these questions.
The very notion of a housing shortage may sound surprising when millions of housing units remain vacant. More specifically, the Q3 2021 HVS report shows there are now 15.2 million vacant housing units comprised of 11.7 million year-round and 3.5 million seasonal units. The year-round category includes 4.7 million homes that are on the market and 7.0 million that are held off the market. Vacant homes that are on the market include 2.7 million for rent, 0.7 million for sale, and 1.2 million rented or sold and awaiting occupancy.
While these are big numbers, they do not mean much unless they are expressed as vacancy rates or percentage shares of the corresponding inventories (see Figure 1) and compared to some historical norms, which are usually approximated by long-term averages.
Figure 1: Year-Round and Seasonal Vacancy Rates
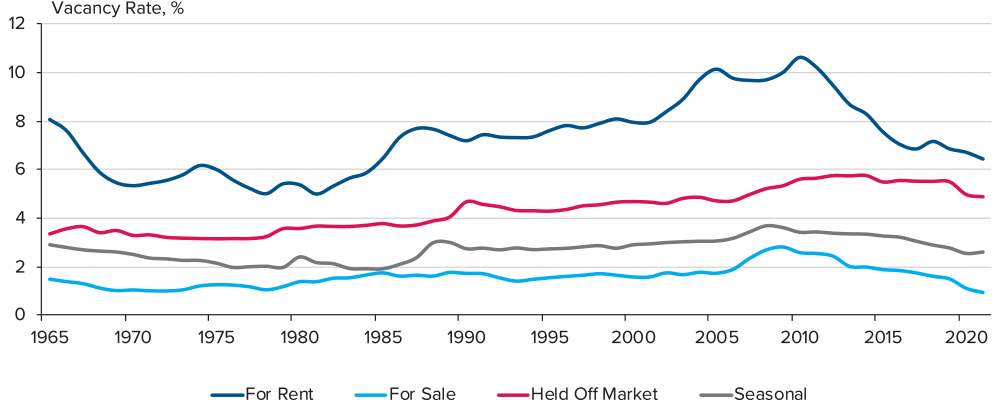
Sources: Bureau of the Census, Berkshire Research
For the purposes of this analysis, we compare the rates over the last four quarters to the 35-year averages calculated using annual time series over the 1986-2020 period, the longest period of data available by segment, units in structure, and geography. The differences are then multiplied by the current stock figures to be converted into units. We also consider the composition of year-round vacant inventory, since over half of it is comprised of units that are held off market but are not considered seasonal, which is treated as a separate category (see Figure 2).
Figure 2: Vacant Units Held Off Market
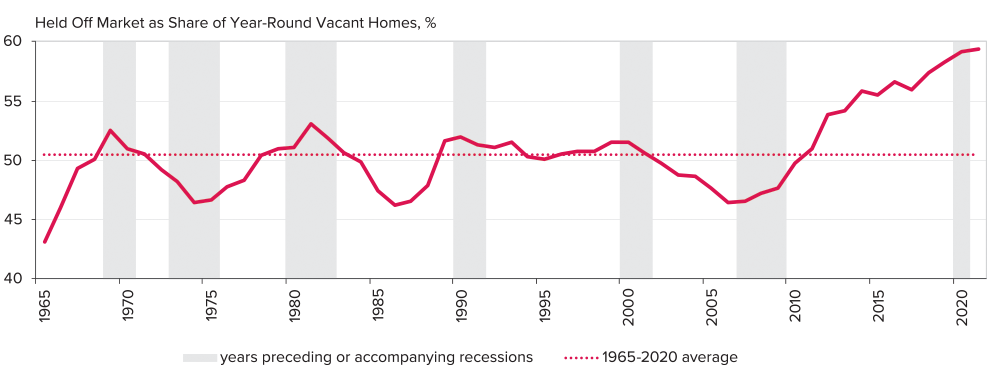
Sources: Bureau of the Census, Berkshire Research
Our analysis suggests that the aggregate housing shortage is now over 2 million units, the highest in over 30 years and likely even longer. Most of the shortage is concentrated in year-round units and is roughly evenly divided between for rent and for sale housing, although rental shortage is clearly more severe on a relative basis given that the current owner-occupied inventory is 83 million units compared to 44 million for renter-occupied inventory (see Figure 3).
Figure 3: Housing Shortage by Market Segment
| Vacancy Rate, % | Housing Shortage | |||
| Segment | Last 4 Quarters | 35-Year Average | BPS | Units, Mil. |
| Total | 10.9 | 12.3 | -140 | -2.1 |
| Year-round housing | 8.5 | 9.3 | -80 | -1.6 |
| For Rent | 6.4 | 8.2 | -180 | -0.9 |
| For Sale | 0.9 | 1.8 | -90 | -0.7 |
| Held Off Market | 4.9 | 4.9 | 0 | 0.0 |
| Seasonal housing | 2.6 | 3.0 | -40 | -0.5 |
Sources: Bureau of the Census, Berkshire Research
In terms of housing sub-types, over half of the overall shortage is concentrated in the single-family segment, while over half of the rental shortage in housing with five or more units in structure (see Figure 4). However, on a relative basis rental housing shortages in the multifamily segment are only slightly deeper than single family. Surging institutional investment in single-family rentals is starting to address the need but recent deliveries of new product in this segment are still relatively low at about 50 thousand units completed in 2020 compared to about 350 thousand units for rental apartments.
Figure 4: Housing Shortage by Tenure and Units in Structure
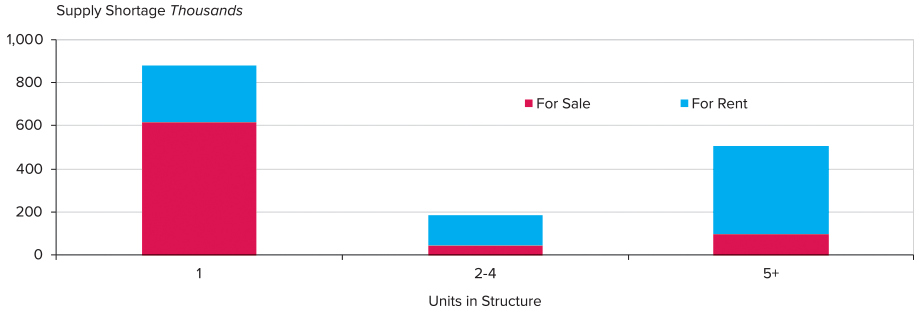
Sources: Bureau of the Census, Berkshire Research
Geographically, the shortage is disproportionately concentrated in the South and West regions of the country and is particularly acute in Nevada, Arizona, Oklahoma, Utah, North Carolina, Florida, and Georgia, where overall vacancy rates for year-round housing are more than 200 basis points below their long-term averages (see Figure 5). On the opposite side of the spectrum is New York—one of the most populous states where housing markets appear to be relatively balanced now and is even potentially facing a slight oversupply in the rental segment. We also find that changes in vacancy rates over the past decade along with migration trends can further explain variations in home price appreciation and rent growth across the nation. Nevada makes a particularly instructive case study of these effects—it is a state where growth in home prices and rents have only accelerated through the pandemic despite record job losses due to the economic shutdown and restricted travel/tourism last year. Given the current levels of new construction in states like Nevada, upward pressure on prices and rents is likely to persist in the near term.
Figure 5: Housing Shortage by Tenure and State
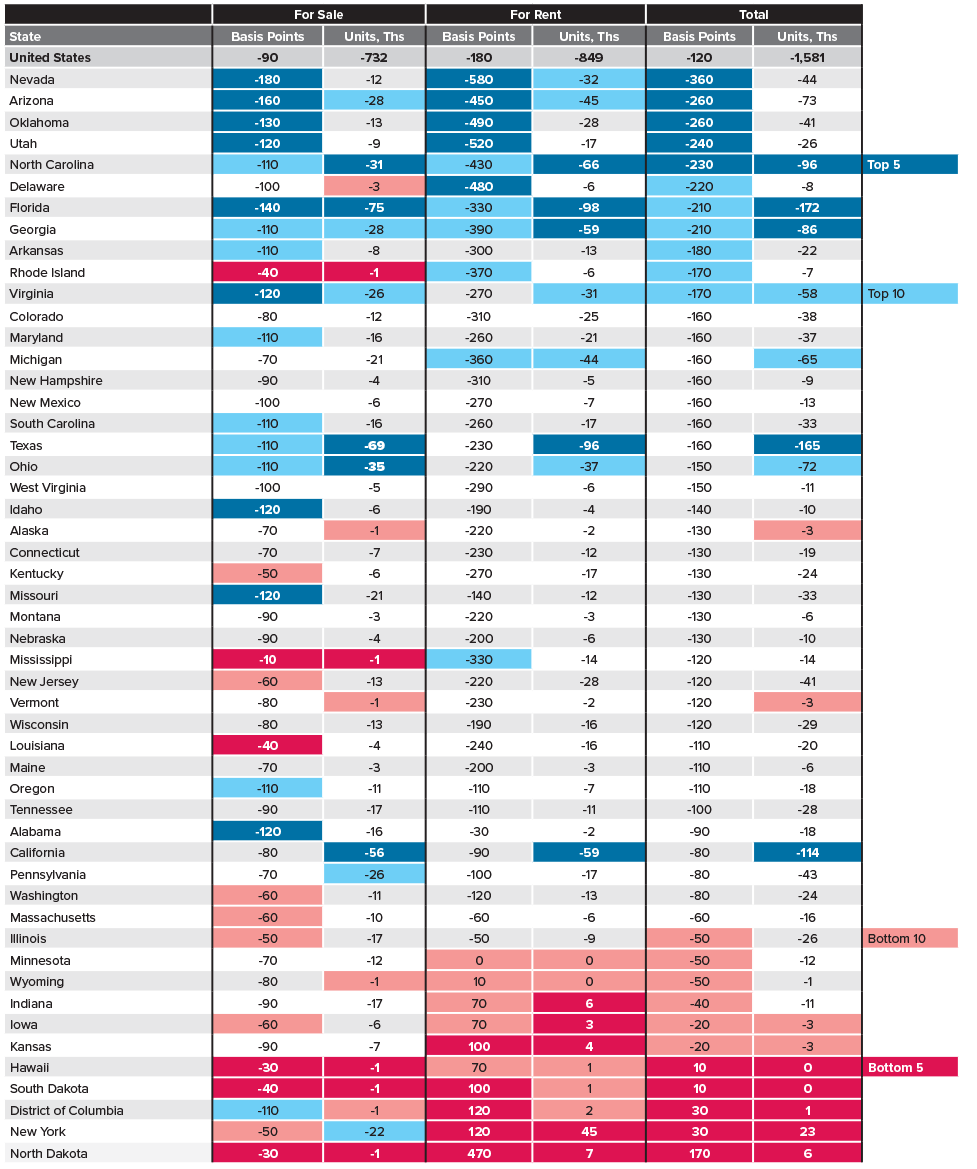
Sources: Bureau of the Census, Berkshire Research
There is another source of supply however that could help alleviate the housing shortage—existing homes that are vacant but held off market. This segment has always been and remains somewhat of a wild card as it tends to be dominated by homes purchased for investment purposes, as a non-primary residence, and for occasional use. Nationally, vacant homes held off market currently account for 4.9% of the year-round inventory and this rate stands right at the long-term average. This said, such homes now account for almost 60% of all year-round vacant homes compared to about 50% historically and in absolute terms this excess shadow supply is close to a million units.
In the past, the share of vacant homes held off market tended to fluctuate with economic and housing cycles. It was at its highest in 1969-70, 1980-82, 1990-91, and 2000-01, years immediately preceding or accompanying recessions. The share was at its lowest during the recession of 1973-75 and the Great Recession, both periods being characterized by sharp, abrupt job losses and a high degree of financial distress, forcing many households to sell in an adverse market. If the U.S. housing market were to suffer a correction (and aggregate oversupply would not be a contributing factor like the last time), we could see the share drop once again, thus helping balance the market. Coincidentally, three key states currently experiencing acute housing shortages, Arizona, Florida, and Nevada, also traditionally happen to have the highest concentrations of homes that are held off market, which contributed to their home price and rent declines in the previous cycle.1
It does not appear that the U.S. housing shortage can dissipate quickly. The current annual pace of new residential supply is about 1.6 million units per year based on construction starts, which is close to the estimated demand from new households of 1.1 to 1.3 million-plus obsolescence/demolitions of 0.2 to 0.4 million. Unless there is a sudden contraction in household growth and/or an influx of held-off-market homes, from a purely demand/supply perspective (i.e., keeping other factors such as wages/incomes and interest rates constant), the upward pressure on housing costs is likely to persist.
Aside from potential macroeconomic and policy implications of the current housing shortage, real estate investors and developers should also consider opportunities as well as risks created by this environment. First, the market clearly needs substantially more new housing for both renter and owner occupancy and in both single-family and multifamily segments. Our prior analysis based on other data sources strongly suggests that virtually all this new supply is needed at the middle and lower ranges of the price spectrum.2 Second, the shortage is concentrated in certain parts of the country and unevenly distributed not only across but also within regions and states, varying widely by market, submarket, and product. In fact, many locations and niches are facing supply surpluses – despite the aggregate shortage. These differences need to be evaluated carefully in the context of shifting demographics, including age, household size, income distribution, migration patterns, etc. Finally, while it is always a good idea to look at one’s growth expectations in inflation-adjusted terms, this is becoming especially important now.
While most baseline scenarios see the recent upward pressures on consumer prices as transitory, the upward pressure on housing costs could keep overall inflation well above 2% which markets have grown accustomed to, and the Federal Reserve considers its target. It helps to remember that “housing is the business cycle,” or at least one of its key components and in this case one that requires a lot more of the right kind of capital investment to keep the overall system functioning well.3 •
This material is for informational purposes only and is not intended to, and does not constitute financial advice, investment management services, an offer of financial products or to enter into any contract or investment agreement.
Endnotes
1. Wheaton, William C. and Nechayev, Gleb, “The 1998-2005 Housing ‘Bubble’ and the Current ‘Correction’: What’s Different this Time?”. Journal of Real Estate Research, Vol. 30, No. 1, 2008, Available at SSRN: https://ssrn.com/abstract=1071044 ↩
2. “Growing Opportunity to Invest in Middle-Income Multifamily” Berkshire Research Viewpoint, Fall 2018. ↩
3. Leamer, Edward. “Housing IS the Business Cycle”, Proceedings – Economic Policy Symposium – Jackson Hole, Federal Reserve Bank of Kansas City, 2007. Available at NBER: https://www.nber.org/papers/w13428 ↩