
Volume 37, Numbers 2&3
Published: Winter 2012
By Charles A. Smith, Ph.D.; Rahul Verma, Ph.D.; and Justo Manrique, Ph.D.

Photo: kryzhov/Shutterstock.com
Introduction
THIS ARTICLE PRESENTS A STRAIGHTFORWARD TECHNIQUE that can be used by appraisers, consultants, asset managers and others in the field to forecast demand for needed new apartment units and trends in rental rates. The types of data required for the analysis are available in all but the smallest market areas and the techniques require only that analysts have a minimum working knowledge of Excel. The ideas and thoughts presented here can also be extended to other property types. This article, therefore, may have benefits to a wide range of constituents in the field working over almost any type of property. A secondary benefit of using a technique similar to what is presented here is to help avoid the sometimes chaotic and destructive gyrations in demand/supply imbalances. If need for space can be more accurately forecast, then imbalances can be reduced.
Historical Perspective
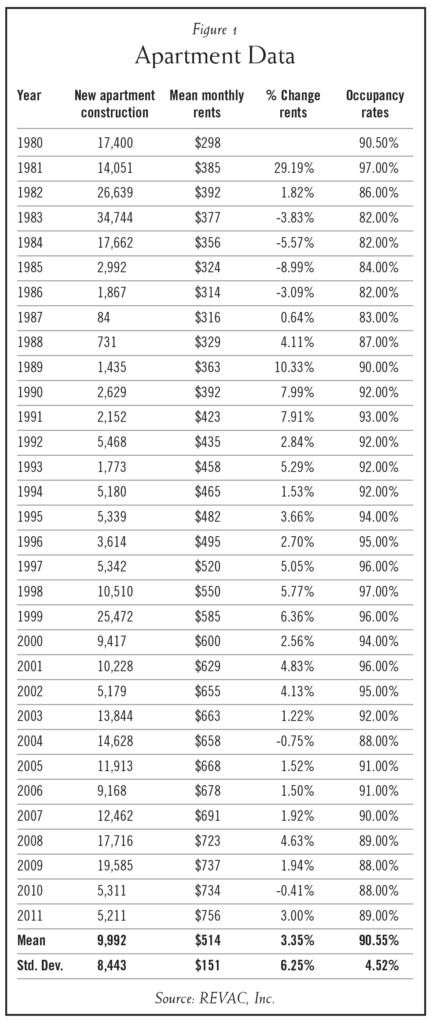
The Houston-area data provided by REVAC Inc. is used to present the historical perspective. Figure 1 reports the annual data on new apartment construction, mean monthly rents, rate of change in rents and the apartment occupancy rate during the years 1980–2011. The mean monthly rent in this area has been approximately $500, which has grown at an average of 3.35 percent per year, while almost 10,000 (average 9992 from 1980–2012) new apartments were constructed every year. Moreover, more than 90 percent of the apartments were leased during this period. However, very high standard deviations as compared to the means in the case of new apartment constructions and growth in rents suggest that the apartment market has been highly volatile in the past. The new apartment construction in 1983 was almost 35,000 units, while in 1987, it fell to only 84. Similarly, the maximum and minimum values of growth in rents were approximately 29 percent and -9 percent during 1981 and 1985 respectively.
The past few years of data indicate that the greater Houston area’s apartment market continued to show signs of weakness in 2009 in terms of rental increases, as rents fell by 0.41 percent after increasing by only 1.94 percent in 2009, and 4.63 percent in 2008. The average rents have increased to $756 a month in 2011 from $298 in 1980.
This represents a 154 percent change over a 31-year period. On average, monthly rents have steadily increased in the subject market area over the past 30 years except for a period during the 1980s when rent decreased because of job losses. This trend was only repeated once again in 2004 where rents dropped from $663 to $658, most likely because of the negative 0.75 percent drop in jobs during the same time. The highest construction of new apartments over the past three decades was in 1983 with almost 35,000 units added. Since then new apartment construction peaked in 1999 at 25,472 units and has not returned to that level to date, with construction in 2011 at 5,211 units.
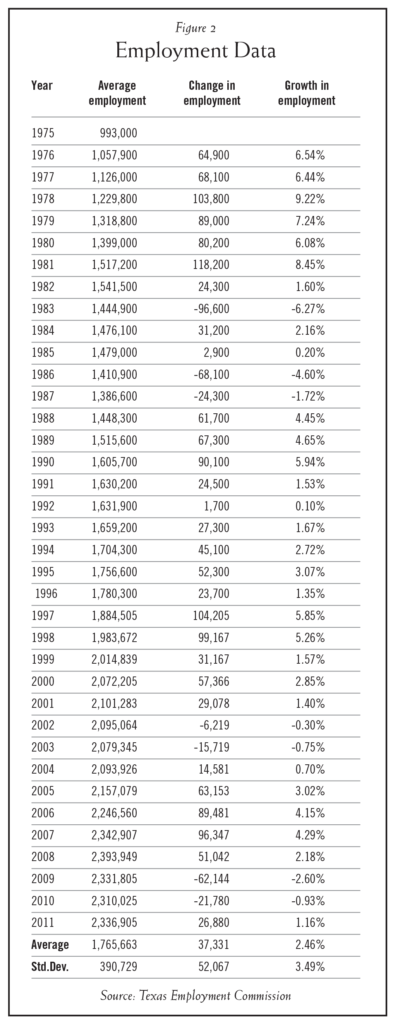 Figure 2 reports the employment data on nonagricultural wage and salary for the Primary Metropolitan Statistical Area (PMSA) obtained from the Texas Employment Commission for the period of 1975–2011. The PMSA data includes Harris, Fort Bend, Montgomery, Liberty and Waller counties, and excludes Chambers County. Specifically, Figure 2 reports the data on average annual employment, change in employment and growth in employment during this period. The average annual employment in these counties has been approximately 1.75 million and has shown an increase of approximately 37,000 new jobs per year—an average growth of 2.46 percent. Standard deviations of changes in employment of approximately 52,000 and 3.5 percent change in employment respectively suggest that the employment scenario has been somewhat turbulent during this period. Although job growth was positive for 2004–2008, the percentage of apartments leased did not change appreciably. This was likely caused by the influx of first-time home buyers during these years. Because of subprime lending, people with little or poor credit were able to qualify for home loans without problems. Most of these were the same people who previously would have leased apartments because they did not have the credit or capital to purchase a house. However, since then, the housing bubble has burst and many of those first-time home buyers have lost their homes through foreclosure because they were unable to make the payments, especially those who were part of the 100,000 who lost their jobs in 2009–2010. It is worth noting that the long-term average is that approximately 65 percent of U.S. households live in owner-occupied housing. This means that about 2 out of 3 households in the U.S. have typically lived in homes they own. Just prior to 2006, this owner occupancy percentage increased to almost 70 percent but is currently falling.
The economic downturn in 2002 that led to approximately 22,000 jobs being lost from 2002–2003 was enough to send the absorption rate to negative 14,564 by 2004. This net negative absorption indicated that 14,546 fewer new apartment units were occupied at the end of 2004 than had been occupied at the beginning of the previous year. The low absorption numbers from 2007–2009 could be also linked to subprime mortgage lending. During this period construction declined, although job growth remained positive.
The two-year drop in employment in 2002 and 2003 that led to approximately 22,000 jobs being lost during those years also caused occupancy rates to drop from 96 percent in 2001 to 88 percent by 2004. But job losses were not the only cause of this reduction in occupancy rates. Even though 15,000 jobs were lost in 2003, almost 14,000 new apartments were constructed that year. In order to compensate for the overabundance of apartments, owners and managers increased rents by only 1.22 percent in 2003, down from a 4.13 percent increase in 2002. Even with more than 14,000 jobs added to the Houston economy in 2004, apartment managers and owners did not see an increase in occupancy, possibly because there were also another 14,000 new apartments constructed during this same period. At this point, management actually lowered monthly rents for the first time since the mid-1980s.
In 1998, when average rents passed the monthly $550 mark for the first time in Houston history, new apartment construction picked up. Construction had not been much more than 5,000 units per year since 1984. The 10,510 new apartments built in 1998 amounted to twice the number built during the previous year. In 1999, construction rose dramatically to 25,472 units, which proved to be an overreaction by developers because by 2000, there was a net negative absorption rate and vacancies increased from four to six percent. By the end of 2011, average rents had reached almost $756 per unit per month and the vacancy rate stood at 11 percent.
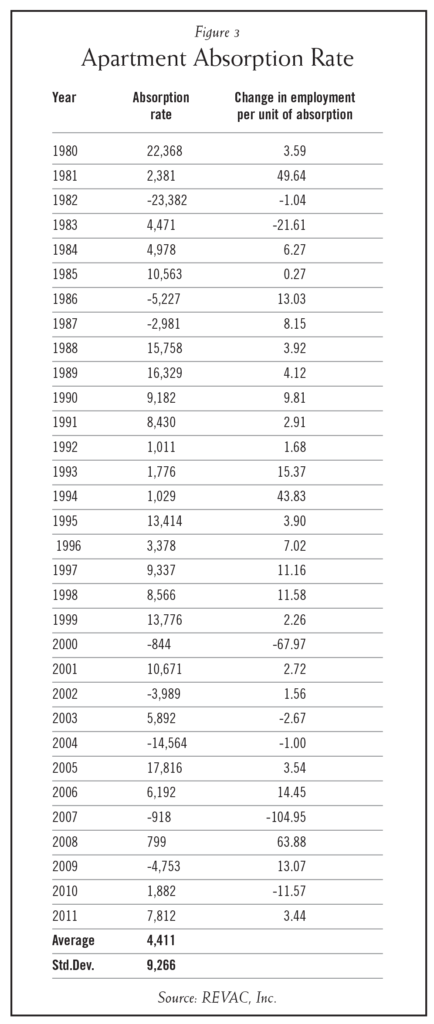 Figure 3 reports the data (REVAC Inc.) on apartment market absorption rate and the ratio of change in employment for each unit of absorption during 1980–2011. The average annual absorption rate during this period is approximately 4,400 while the mean ratio of absorption and growth in employment is 6.86 for 30-plus years. This ratio of 6.86 means that between 1980 and 2011, for each 6.86 jobs created, there was one additional unit that became occupied. Consistent with the findings in figures 1 and 2, these two variables also seem to suggest a strong variability in the new apartment rental market.
Forecasting Methods
Figures 1, 2 and 3 contain historical information relating to the overall new apartment market in the Houston area; it also contains an analysis that can be used for forecasting purposes. Figure 4 contains a simple ratio analysis that can be beneficial in forecasting new apartment unit absorption over a long time frame. Specifically, we compute the following four ratios:
- Absorption per unit of employment;
- New jobs per unit of absorption;
- Jobs to 100 percent occupancy;
- Years to 100 percent occupancy.
The average employment gain per year for the past 30-plus years has been approximately 37,000 net new jobs. The past decade, which has seen two recessions, still had an average employment gain of 24,000 jobs per year (See Figure 2).
While the area has gained about 24,000 jobs per year over the past ten years, there have been just over 2,600 new apartment units absorbed each year. The crux of the idea presented in this paper is that there is a long-term, somewhat stable relationship between net new jobs created and absorption of space. By dividing the average per year job growth of 24,000 (past 10 years) by the average absorption of apartment units per year, an indication of the relationship between job growth and apartment absorption can be determined. Over the past 10 years approximately 236,000 new jobs have been added and approximately 27,000 net new units absorbed. The ratio of 8.79 (235,632/26,840 = 8.79) is for the last 10 years. The ratio is 6.86 jobs per unit for the previous 30 years. This reinforces our discussions concerning the effects of the recession, the subprime market and changes in home ownership. Therefore it is imperative that the analyst in the field select the proper time frame that mirrors the market forces during the period being analyzed.
After estimating the relationship between job growth and apartment unit absorption it is then possible to estimate how long it will take to reach 100 percent occupancy. While we recognize that 100 percent occupancy has never been reached, the “index” of years to reach 100 percent serves as a “gauge” of the health of the new apartment market as influenced by the job market. The last row in Figure 4 contains an index of years to 100 percent, which indicates that if no new apartment units are built and job growth averages 37,000 per year; the vacant units will be filled and the overall vacancy rate in the Houston area will be zero in approximately twelve years.
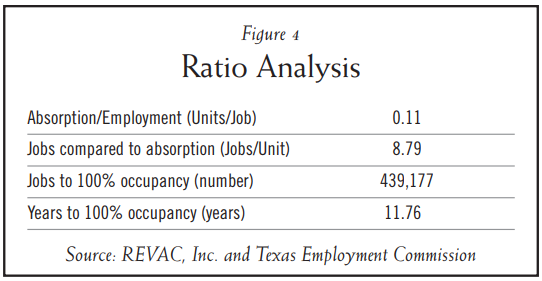
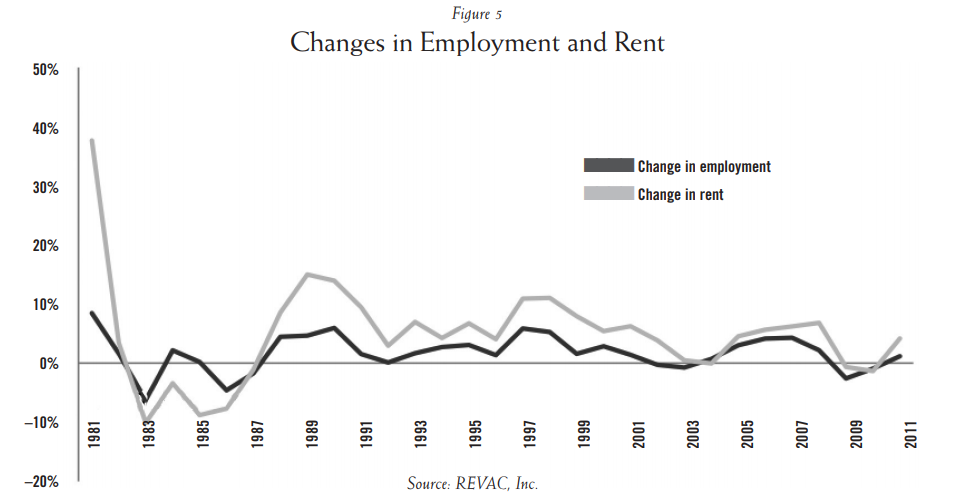
Figure 4 compares the percentage change in employment, with percentage change in rental price. It is evident that these two are directly related when looking at this chart. The two rise and fall in a distinctive pattern. First, employment changes and then rents tend to follow the same course. This supports the idea that a drop in employment will result in lower, or stagnant, rents. Looking at changes in employment can be an accurate indicator for those observing the new apartment market because, over decades, the same has usually been true. This indicates that new apartment owners and landlords can anticipate a need to lower, or not raise, rents during periods of little or no job growth.
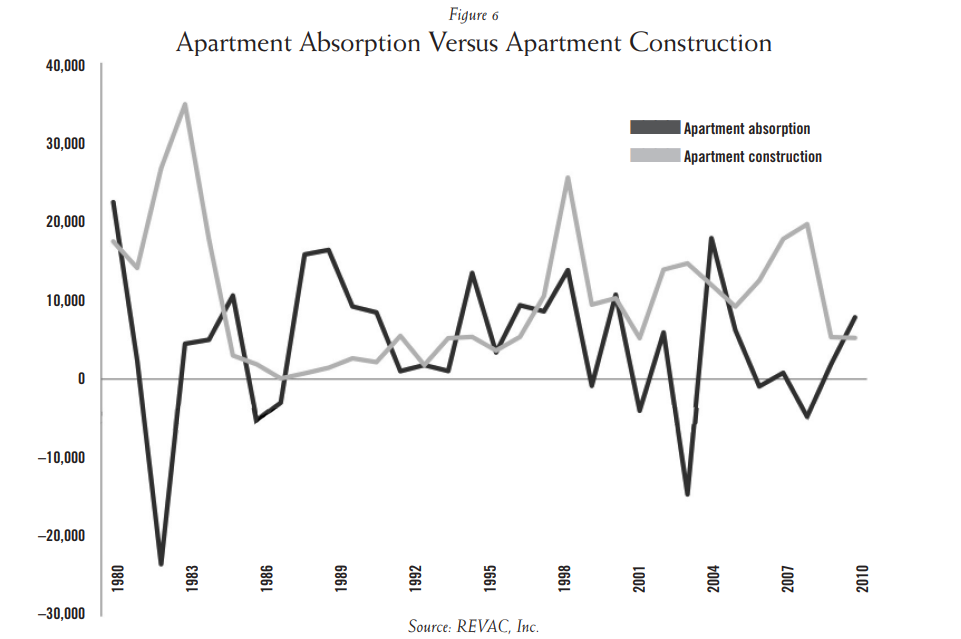
A comparison of new apartment construction and absorption rates can be found in Figure 5. The data indicates that construction and absorption are not correlated. In an ideal world, new apartment construction would occur when demand for new apartments was rising. However, this is not an ideal world, and there is a lead time for completion of new apartment buildings. An area may show a high absorption rate over a certain period—perhaps a year or more—leading investors and builders to speculate the need for new apartments, and so the process begins. First, land must be located and purchased, designs must be created, permits pulled, and after months or even years, ground can finally be broken on a new project. There is the time it takes to complete construction. During this time, the demand for new apartments can drop drastically, but in most cases construction cannot be stopped. This only lowers the absorption rate because the pool of available new apartments is larger than it was before.
During the period from 1988–1996, the employment compared to absorption was just over six, which correlates to the creation of 141,000 jobs needed to fuel all new area apartment units. A look over the past 10 years shows dramatic change from the previous 20-plus years. The jobs compared to absorption ratio was 8.79 during the past decade meaning almost 562,735 new jobs would have had to have been created in order to lower apartment vacancy to zero. Relatively low changes in employment are one reason there is a large variance between time periods. Still, that does not account for the constant falling percentage of leased apartments.
As mentioned previously, during the past decade, the country saw the expansion and collapse of a housing bubble. According to data collected by the Census Bureau, homeownership peaked in the second quarter of 2004 at 69.2 percent. Ten years prior, peak ownership was hovering at approximately 64 percent and, dating back to 1965, that percentage had never crossed the 66 percent mark. Even though the difference between 69 and 64 may only be five percentage points, this is a representation of 5 percent more Americans owning homes than ever before. Five percent of 110 million households is more than 5 million fewer tenants and a corresponding number of new homeowners. The massive increase in home ownership reduced the large portion of people who had once been new apartment renters.
The changes that occurred in the housing market after 2000 were enough to skew the data in Figure 1 all the way back to 1980. The first quarter of 2010 shows home ownership rates to be at 67.1 percent, which is the lowest since the first quarter of 2000. One could speculate that this would mean the percentage of new apartments leased would be similar to what they were in 2000. However, at the end of 2009, only 88 percent of Houston’s apartments were leased compared to 94 percent in 2000. So the question is: where are all of the homeowners living now if new apartment occupancy rates are not increasing? Popular press is replete with articles detailing an unusually high percentage of young adults living back at their parent’s homes.
Many people who found themselves losing their homes also lost their jobs, leading to the inability to make mortgage payments. If these people remained out of work, simply making rent payments might be too much of a burden. This means people would have had to move in or double up with family or friends. Children who had moved on from their empty-nester parents were now claiming their old rooms back. The popular press has chronicled the large increase in multi-generational households. Friends who had enjoyed living on their own would have to search for roommates to lower their rent costs. In general, more people are living in fewer housing units than before. Additionally there are millions of people in the U.S. who have stopped making mortgage payments and have remained in their homes for long time periods as lenders face extreme problems in the foreclosure process.
Another possibility for fewer people renting new apartments could be attributed to the increase in single-family homes for rent. Some people who wanted or needed to sell their home in this economy have found great difficulty in doing so. In an attempt to create some cash flow from a house that would otherwise be nothing but an expense, owners have opted to lease the house in hopes of attracting people who are not looking to buy. Others may be leasing their homes in hopes of riding out the current economic problems and selling it at a later date when their chance of profit is greater.
Conclusion
This article presents a straightforward useable technique that practitioners in the field can use to help forecast absorption of apartment units. The data indicate, in the sample market area of Houston, Texas, that for each eight-plus (8.79) jobs created; one additional new apartment unit becomes occupied. This information is especially useful when appraisers, land planners, consultants or others are attempting to estimate how long it will take for a single new apartment complex to reach stabilized occupancy; or how long it might take for an entire overbuilt market to reach equilibrium in terms of balance in demand and supply. While this article has focused on a practical straightforward technique that can be adopted by practitioners in the field; there is ripe opportunity for additional research investigating statistical linkages between market segments endogenous to real estate and variables exogenous to the real estate market; such as traffic counts, oil prices, interest rates, etc.