 Photo: Jeff Whyte/Shutterstock.com
Introduction
A well-constructed restaurant building can stand for 40 years, or perhaps much longer. However, as this article seeks to explore, the economic life of a restaurant building, or the period for which this use remains appropriate and viable, can be, and often is, much shorter.
Restaurants are special-purpose properties where real estate is sometimes intermingled with a highly speculative business. Moreover, restaurant properties rarely age well unless fed a steady diet of capital improvements. For these and other reasons, restaurant properties can transition through their economic life quickly. The authors contend that there are four distinct stages in the life cycle of a typical restaurant property, and that understating this progression can be invaluable to investors in this market and those that counsel them.
Is a Restaurant a Retail Property?
There are many physical similarities between a restaurant property and typical retail property, but the differences are significant enough to distinguish restaurants as a separate asset class that requires a different perspective for appropriate analysis. A restaurant is essentially the combination of real estate and intangible business value, which results in a dramatically higher risk profile than a typical retail property. As a result, there is a level of complexity in operating a restaurant and analyzing a restaurant investment not found with many other types of retail properties.
“It’s very easy to get into the restaurant business, but very difficult to be successful.”
David Rice, co-owner of Southern Hospitality Group
Functionality and Economic Life
As most real estate professionals who have been in the business for several cycles can attest, small buildings of any type on a prime commercial site are at risk of having a short economic life. What can have a particularly constraining influence on economic life, though, is design flaws in the improvements. Therefore, it follows that a restaurant property with a significant design flaw may not remain a restaurant property for long. This is an extremely relevant concept for restaurant property analysis, since shortcomings in design are fairly common for this property type.
While developing opinions about functionality can be challenging, what heightens the complexity of this issue further is that restaurant design, architecture and build-out requirements are typically user-specific. Therefore, restaurant investors and their advisers need to be mindful of the possibility that what suits one user may not be sought by another. Moreover, restaurants are not easily converted to alternative uses, so once a restaurant property loses its appeal for that use, it is unlikely that alternatives will exist whose market rent or value will rival what is needed to justify the original construction cost.
A user-specific design is not the only cause of properties being obsolete. Older properties in general are likely to exhibit obsolescence because design preferences change, and what had been start-of-the-art often becomes outdated. An example of a change in design is that restaurant buildings are now generally smaller than they were in the 1970’s and 80’s. Citing Perkins and Chi-Chi’s as having designs typical of restaurant of that era, Fred J. Campbell, CRE, who has managed all of the real estate needs for a restaurant group in the upper Midwest for more than 15 years, states that buildings of that size are “too expensive to retrofit.”1 He further explains that this is an important consideration because “restaurants get beat up,” and adds that larger properties are also less desirable because they exacerbate the challenge the restaurant industry has in hiring and retaining staff. Mr. Campbell also notes that a large restaurant building can be a disadvantage because “demolition costs can be surprisingly high, especially due to local regulations.” A similar thought was shared by Bruce E. Jones MAI, ASA-GC, BCA, CMEA, an experienced restaurant appraiser and Principal & Chief Appraiser of RMS Commercial Group, LLC, who shared that “There are many, many older restaurant properties that are now oversized. The ideal restaurant size has been getting smaller and many of these older over-sized properties wind up getting knocked down or converted to things like medical office space because they are just no longer viable as restaurant spaces.” Interestingly, though, many larger restaurants recently weathered the COVID-19 pandemic better than smaller properties where social distancing could not be achieved.
Another example of a change in restaurant design is that some chains, such as Pizza Hut and McDonald’s, are shifting toward drive-thru models and kitchen-only locations in order to fill as many mobile orders as possible. This trend began prior to the COVID-19 pandemic and accelerated from there. Perhaps the most notable example is the early-2021 announcement by Starbucks that its preference for future real estate development will be a concept of drive-thru only. The company plans to build new outlets focused on this concept, and also renovate about 150 stores that are “drive-thru constrained.” The model, which Starbucks tested in a variety of cities in the years prior to the announcement, does not include interior seating, though it may have a pickup window for customers on foot, and a few outside tables. These new stores will be much smaller than those built previously.
Other Potential Limitations of Economic Life
While highest and best use analysis is relevant for all property types, the hyper-competitive nature of the restaurant business heightens its importance for restaurant properties. As Bruce Jones MAI, ASA, BCA, CMEA points out, “restaurant locations that become temporarily saturated with too much competition tend to be far more impacted than other more traditional property types.”2 Not surprisingly, an over-supply of this property type is often a contributing factor in why some restaurant properties are converted to an alternative use or razed.
In addition to supply and demand, understanding the real estate cycle is also critical to restaurant property investments. D. Scott McLain, JD, CRE, CCIM cites that at the peak of the real estate cycle, even many restaurants with secondary locations or impaired visibility from the road can prosper.3 However, as the economy softens, it is not unusual to see restaurants with limited visibility close, while those with prime locations are able to weather the downturn. Mr. McLain advises caution when evaluating a restaurant that “is not respecting the rules of the restaurant business”.
The Stages in the Life of a Restaurant Property
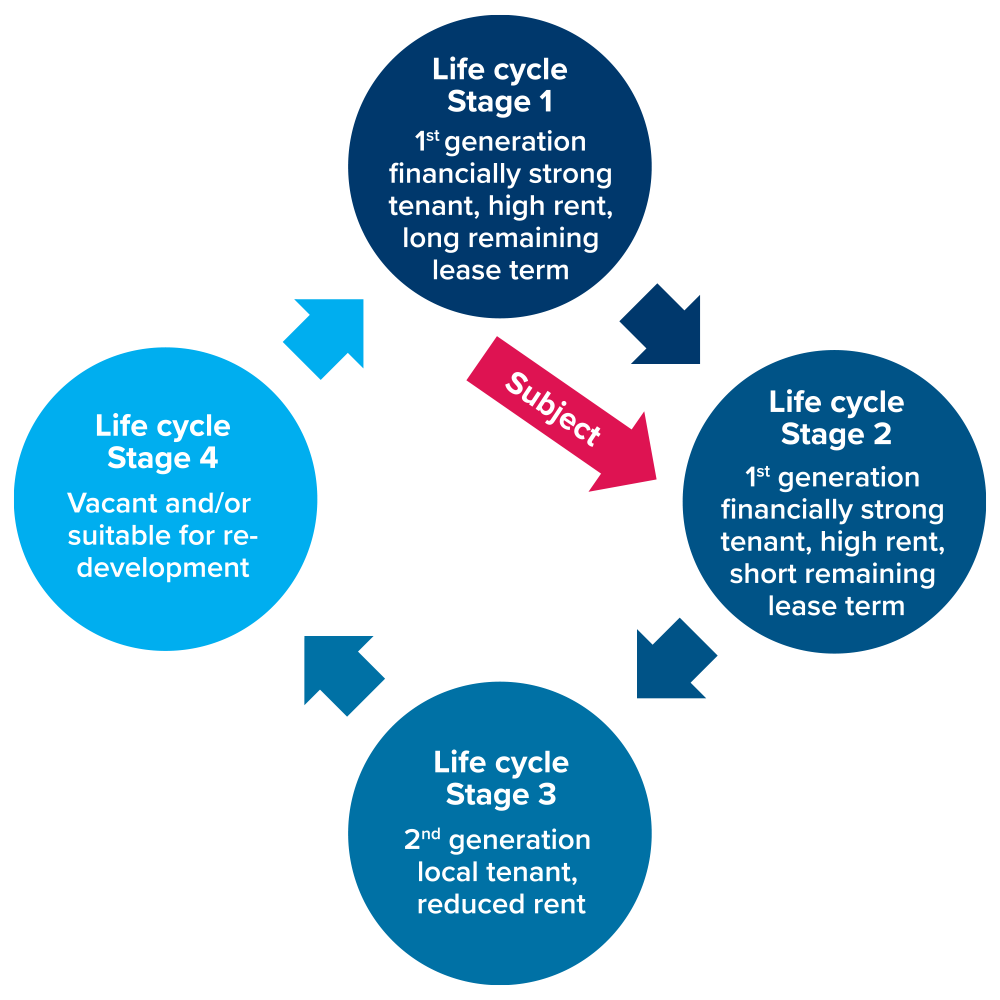
As we have seen, understanding the real estate cycle is critical to restaurant property investments, particularly given the challenges inherent in being successful in this business. Given this observation, the authors find it particularly useful to view the life of a restaurant property in distinct stages (see Figure 1).
Many restaurant properties begin their economic life designed for a financially strong tenant who will pay rent sufficient to justify their specific requirements, and eventually transition through their life cycle to being suitable only for conversion to an alternative use or re-development. To better understand this gradual transition, it is helpful to view the life of a typical restaurant property as a continuum with four stages.
Let’s take a closer look at each stage in this cycle.
Figure 1: Property Life Cycle Stages
Life Cycle Stage 1
Restaurant properties in Stage 1 of their life cycle are typically new, functional, and have their entire (economic) life ahead of them. They are most commonly designed for a national operator, and often leased. However, properties newly-constructed by an independent restaurateur would also be classified as being in Stage 1, as would those newly-constructed restaurant properties that are owner-operated (by either a chain or an independent restaurateur).
A common scenario for a restaurant property in Stage 1 of its life cycle would include the following characteristics:
| Occupancy | Financially strong tenant |
| Remaining lease term | Long |
| Design and appearance | Modern |
| Typical buyer profile | Institutional, 1031-market |
| Likely cap rate | Low |
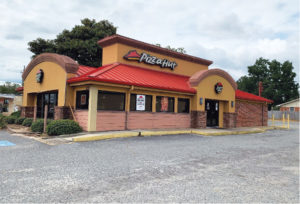
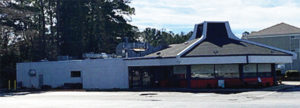
Photo: Example of a Restaurant Property in Stage 1 of its Life cycle
Life Cycle Stage 2
Restaurant properties designed for national operators are best described as having transitioned into Stage 2 after a significant amount of the initial lease term has elapsed. While a limited remaining lease term is often a defining trait of a Stage 2 property, owner-operated properties beginning to show their age would also be described as being in Stage 2.
A common scenario for a restaurant property in Stage 2 of its life cycle would include the following characteristics:
| Occupancy | Financially strong tenant |
| Remaining lease term | Short |
| Design and appearance | May be dated, and image-compliance issues could be a concern if part of a chain |
| Buyer profile | Fewer buyers, given the uncertain future |
| Likely cap rate | Moderate or higher |
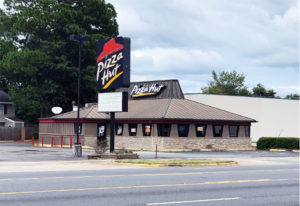
Photo: Example of a Restaurant Property in Stage 2 of its Life Cycle
Life Cycle Stage 3
Restaurant properties no longer sought by a national operator or well-capitalized independent operator are often best categorized as being in Stage 3 of their life cycle. Characteristics common to restaurant properties in Stage 3 of their life cycle include:
| Occupancy | Local operator |
| Remaining lease term | Short remaining lease term or owner-operator |
| Design and appearance | Typically dated, and often retains characteristics reminiscent of its original occupant |
| Buyer profile | Owner-operator; possible interest from local investors, but limited by the uncertainty of the income stream |
| Likely cap rate | High, if applicable |
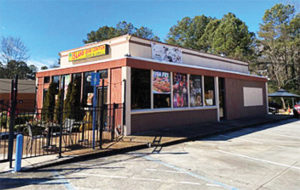
Below is an example of a restaurant property in Stage 3 of its life cycle. The property that had operated as a Pizza Hut for many years, but is now known as JG Chicken & Seafood, the self-proclaimed home of “off the hook fried food.”
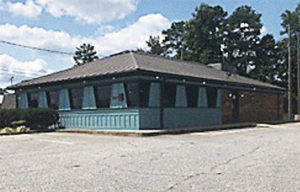
Photo: Example of a Restaurant Property in Stage 3 of its Life Cycle
Life Cycle Stage 4
Stage 4 restaurant properties are those no longer suitable for this use, with their highest and best use having transitioned to re-development of the site or significant rehabilitation (and often conversion to an alternative use). In this scenario, the most likely buyer may well not be a restaurant operator or landlord.
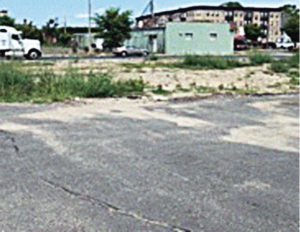
Photo: Lifecycle Stage 4 Restaurant Property (improvements razed, site ready for re-development)
It can be hard to determine if the highest net present value for an older property is repurposing or re-development without actually exposing it to the market to see what interest it draws; therefore, as a restaurant property nears the end of its economic life, highest and best use is often quite complicated.
Furthermore, vacant or failing restaurants are not always well-suited for alternative uses. While there are many examples of restaurant buildings being converted to general retail space or even offices, they rarely generate rent levels anywhere close to what is needed to justify the property’s replacement cost. Not surprisingly, these repurposing projects are often just interim uses until re-development occurs.
Life Cycle Stage Considerations
Some of the factors affecting which stage of its life cycle a restaurant property is in are its physical characteristics, remaining lease term, and sales generated by the business.
Physical Characteristics
Restaurant properties rarely age well unless fed a diet of capital improvements. The following are photographs of restaurants that have had no recent capital improvements.
Restaurant real estate expert Fred J. Campbell, CRE shares that not only is constant upkeep required, but a “fresh look” is typically needed every three to five years. Mr. Campbell adds that for a nice restaurant, a substantial reserve fund should be established, similar to what is done for hotels (with approximately 3-5% of revenue being typical). D. Scott McLain, JD, CRE, CCIM expressed the opinion that a restaurant building operated by a corporate/national operator will need a “significant re-fit every 10 or 15 years.”4 Accordingly, it is not unusual for a restaurant property to slip into the next stage of its life cycle about five years or so after its last minor remodeling, with significant risk approximately 10 to 15 years after its last major remodeling.
Remaining Lease Term
Remaining lease term is correctly thought to influence what capitalization rate can be achieved, but it can also affect the profile of the most likely buyer. Consequently, the remaining term can be a decisive factor in evaluating life cycle stage and other marketability factors for leased properties.
The best measure of an investor’s enthusiasm for a given property type is usually the yield (or capitalization rate) they will require. Note in Figure 2 the clear correlation between remaining lease term and capitalization rate.
Figure 2: Median Asking Cap Rate by Lease Term Remaining
| Lease Term Remaining | Cap Rate |
| 20+ | 5.35% |
| 15-19 | 5.50% |
| 10-14 | 5.85% |
| Under 10 | 6.45% |
Source: The Boulder Group, 2nd Quarter 2020 Net Lease QSR Market Report
The impact of the remaining lease term on the cap rate may be even more pronounced than is apparent in this exhibit since the “Under 10” category is somewhat broad. For example, there is a big difference between a remaining lease term of nine years versus, say, three years. Investor surveys rarely capture rates applicable to properties with a lease that is nearly expired since such properties are rarely of interest to investors. This in itself speaks volumes about how much further into their economic lives properties with short remaining leases are in comparison with when their lease began.5 Not surprisingly, the authors’ experience suggests that the increase in cap rate is far more pronounced when the remaining lease term falls to just a few years.
As we have seen, the remaining lease term can affect both the capitalization rate that can be achieved and the profile of the most likely buyer. When the end of the lease is in sight, there is often a significant risk that a period of vacancy may be near. How do investors assess the likelihood of an interruption of the income stream? One meaningful indicator of a restaurant operation’s prospect for continued viability is to analyze the sales per square foot being achieved.
Restaurant Revenue
The amount of rent a tenant can pay, and the value to an owner-operator, is ultimately a function of the revenue that can be achieved at that location. Consequently, few things speak louder to a landlord or buyer about the viability of a restaurant than the sales being achieved.6 Unfortunately, this information is not always available. However, in other cases, it is obtainable. In fact, many tenants are required by their lease to report sales to the landlord, and it sometimes factors into the amount of rent they must pay.
So, how much does a restaurant need to gross to stay in business? As of the date of this writing, some generalizations useful for illustration purposes are that a full-service restaurant would typically need to generate at least $150 of annual sales per square foot to meet expenses. At sales of $150 to $250 per square foot, full-service restaurants can usually achieve a small profit – if costs are kept in line. At sales of $250 to $325 per square foot, a full-service restaurant can usually expect to see moderate profits of 5% to 10% of total sales, before income taxes. A large profit typically becomes attainable at a full-service restaurant when sales surpass $350 per square foot.7
Limited service/casual dining restaurants typically have lower menu prices, and therefore need to achieve higher gross sales to meet expenses.8 A limited-service restaurant that achieves less than $200 of sales per square foot is unlikely to be sustainable. At sales of $200 to $300 per square foot, a limited-service restaurant where expenses are adequately managed can typically achieve a small profit. At sales of $300 to $400 per square foot, a limited-service restaurant can usually expect to see moderate profits (5% to 10% of sales, before income taxes). A large profit often becomes achievable for a limited-service restaurant when sales are in excess of $400 per square foot.9
To see how well industry norms relate to whether a specific restaurant tenant can afford to honor or renew their lease, we must also look at occupancy cost. For example, if sales at a given property are low by industry standards, that does not necessarily mean that the operation cannot support a correspondingly low rental rate. Conversely, some rent levels would be too high even for a property achieving a high sales volume. An industry rule-of-thumb is that rent should generally equate to no more than 6% of total sales, with total occupancy cost being no more than 10% of total sales.10 Of course, rules of thumb are generalities (at best), and often change over time. Moreover, the relevance of this particular rule of thumb is heavily influenced by the food and labor costs associated with the type of restaurant being operated. For example, $1 in pasta sales is likely to yield a far better margin than $1 in wine sales.
Most Likely Buyer
Understanding the profile of a property’s likely buyer is critical to developing an effective marketing plan, including appropriate pricing for disposition. Identifying the profile of the most likely buyer is also the bridge that connects the highest and best use opinion with the selection of comparables if the property is to be valued. Let’s take a look at some restaurant property buyer profiles, which we will then tie into the concept that restaurants have distinct life cycle stages.
Buyers New to Restaurants and Strategic Buyers
Mary O’Connor, ASA, CRE, CMI, CFE, Partner with Chicago-based Forensic and Valuation Services of Sikich LLP, thinks of buyers as being in one of two categories: those from outside the restaurant business looking to enter the industry, and those from within the industry looking to apply their skills or capital in a new venture.11 Regarding the first group, Ms. O’Connor explains that there are people who think that “for whatever reason, they want to own a restaurant,” and these buyers typically offer “only money.”
The second group, though, which Ms. O’Connor describes as a “strategic buyer,” are operators with a strong restaurant background who usually have excellent supplier relationships, an outstanding menu, and so on.
The importance of understanding which buyers are in which category is that “they will pay a different number.” The strategic buyer, who can use their expertise to enhance the enterprise “can, and may, pay more – especially if the location fits the demographic they seek.” Buyers with no restaurant expertise, though, who “offer only money,” are more limited in what they can pay to achieve a good outcome. Moreover, the risk that the enterprise will not be successful is far greater with the buyer with no restaurant expertise.
Other Types of Restaurant Buyers
The buyers Ms. O’Connor describes accounts for many restaurant property purchases. In addition, some purchases are made by large restaurant companies, and others by investors who seek an income stream without ever being involved in a restaurant’s operation. It is not unusual for large portfolios of restaurant properties with financially strong tenants to be sold in bulk to institutional buyers who then hire property managers (and sometimes asset managers) to handle most of the responsibilities typically borne by the landlord.
Restaurant Property Buyer Profile Matrix
The table in Figure 3 summarizes what we have discussed to this point as it relates to what type of buyer is most likely to seek what type of restaurant property.
Figure 3: Restaurant Property Buyer Profile Matrix
| Stage/Occupancy | Appeal to Investors | Appeal to Owner- Operators | Comment(s) |
| Stage 1/Tenant-operated | High | Low | Often a build-to-suit, with cost justified by rent |
| Lease term is usually long; tenant quality is also key, with a financially strong tenant not being unusual | |||
| Particular appeal to 1031 Exchange buyers | |||
| Institutional investors often interested in large portfolios of these properties | |||
| Value can be more than cost | |||
| Stage 1/Owner-operated | Low | High | Often a build-to-suit, somewhat reflective of the owner’s personal preferences |
| Appeal to owner-operators is high, though they often opt for new construction of their own design | |||
| Value sometimes less than cost | |||
| Stage 1/Vacant | Low | High | Often a distress situation |
| Appeal to owner-operators is high, though they often opt for new construction of their own design | |||
| Value often less than cost, and perhaps far less | |||
| Stage 2/Tenant-operated | Moderate | Low | Remaining lease term is a detriment to marketability |
| Unlikely to appeal to institutional investors, unless bundled as part of a portfolio | |||
| Value likely to be far less than replacement cost | |||
| Sales volume achieved by tenant could be a major enhancement to or detraction from marketability | |||
| Image-compliance issues could be a concern if part of a chain | |||
| Stage 2/Owner-operated | Low | Moderate/High | Value likely to be less than replacement cost, unless a successful business is part of the valuation |
| Sales volume achieved could be significant to value | |||
| Image-compliance issues could be a concern if part of a chain | |||
| Stage 2/Vacant | Low | Moderate | Often a distress situation |
| Value often far less than replacement cost | |||
| Stage 3/Tenant-operated | Modest | Low | Lease usually has a short remaining term, and/or a local tenant |
| Buyer would usually be a local investor | |||
| Value often just a fraction of replacement cost | |||
| Stage 3/Owner-operated | Low | Modest | Value likely to be far less than replacement cost, unless a very successful business is part of the valuation |
| Sales volume achieved could be significant to value | |||
| Stage 3/Vacant | Low | Modest | Often a distress situation |
| Value sometimes just a fraction of replacement cost | |||
| Highest and best use determination can be complex | |||
| Stage 4/Vacant | Low | Modest | Buyer may not intend restaurant use |
| Buyer could be a restaurant operator planning a substantial renovation and therefore viewing the property as being somewhat competitive with a vacant development site | |||
| Value sometimes similar to land value (and can actually be less, if demolition cost should be deducted) | |||
| Highest and best use determination can be complex |
Let’s look at these concepts within the context of a case study.
Highest and Best Use Case Study
The Property
A local restaurateur operated a pub in a suburb of a major city. A large variety of gourmet beers were offered, along with a limited selection of food. Catering was also available.
The Location
The property was in a pedestrian-friendly area that had become somewhat of a fashionable district for high-income diners. This was largely the result of an eclectic mix of several popular restaurants that had opened in recent years that drew big crowds.
The Improvements
The building contained 3,200 square feet, nearly half of which was a second-floor office. The floor plan for the main level was designed for restaurant use, although the kitchen was somewhat small. The first floor had been recently renovated, and most of the customer areas were in good overall condition. The mechanical systems, however, were fairly old. There was limited furniture, fixtures and equipment (FF&E), and it was also fairly old.
The Business
The business met its expenses, but did not thrive the way most of the nearby restaurants did. The operator was fairly new to the restaurant industry, and never achieved the pro forma upon which his initial investment was based.
The Disposition
Tired of struggling, the owner listed the property for sale. An offer of $1,400,000 was received and accepted shortly thereafter. The purchase price included the real estate, FF&E and the business, but the real property accounted for almost all of it. The contributory value of the FF&E was minimal, and there was no discernable business value.
The Buyer
The buyer was a small local restaurant group that had established an impressive record of turning around struggling businesses. They were attracted to the property because of its location in a market they had sought to enter for some time.12
The Vision
Prior to making their purchase offer, the buyers developed a strategy to increase revenue and profits. They began this process by identifying what was wrong with the property.
- They found there to be limitations with the existing kitchen, as it was apparently designed primarily for catering and would not accommodate a “full” menu without some modifications. The catering business never got much traction, so as a practical matter the kitchen was mostly used for appetizers. It was small, had a choppy layout, and too small a ventilation hood.
- The amount of office space was far in excess of what was needed.
- The bar was too far from the kitchen.
- Few design changes could be accomplished without modifications to the sprinkler system, which meant upgrades and updates to the property’s plumbing.
The Renovation
The new owners designed and executed the following renovation plan:
- The kitchen was upgraded to allow for a “full” menu.
- A new ventilation hood and related equipment were installed.
- Additional sprinkler lines and heads were installed.
- A partial demolition of the second floor resulted in the first level having a much larger, open feel. The remaining second-floor area was used for additional seating and special events.
- The bar area was relocated to be near the kitchen for improved flow.
- Customer restaurant rooms were refurbished.
- HVAC systems were upgraded as needed.
The Cost
The cost was budgeted at $135,000, summarized as follows:
- $30,000 – partial demolition of second floor
- $21,750 – engineering & design, permits, interest and bank fees
- $21,230 – ironwork, sheetrock, framing, vanities and countertops, paint, and cabinetry and case work.
- $19,000 – new ventilation hood and related equipment to be “bolted” to the floor
- $13,000 – plumbing, electrical and fire protection
- $11,700 – rental, clean up, general contractor fees, and insurance
- $11,400 – mechanical and HVAC
- $2,500 – masonry and concrete
- $1,550 – miscellaneous
- $2,870 – contingency
The Value
An appraisal performed when the property was purchased confirmed that the $1,400,000 purchase price was reasonable at that time. An appraisal done after construction indicated a post-renovation value of $1,550,000. Both appraisals reflected real property only.
Return on Investment
The contributory value of the proposed construction is the difference between the value of the property prior to construction and after, or $150,000 ($1,550,000 – $1,400,000). By comparison, the investment required to achieve this $150,000 increase in value was $135,000.
The profit/loss of this venture can be measured in a number of ways:
| Profit from construction | $15,000 ($150,000 – $135,000) |
| Return on investment | 11% ($15,000 ÷ $135,000) |
| Recapture of investment | $1.11 per dollar of capital investment was recovered ($150,000 ÷ $135,000) |
From a real estate investment perspective, the profit was somewhat modest, and the opportunity for a $15,000 gain may not have interested many real estate investors. However, many owner-operated properties are renovated without the incentive of any real estate profit at all, and are often done at a loss. The motivation for the new owners was to re-position the property in such a way that they could pursue greater business profits, and that any profit at all was achieved was a result of the functional enhancements made.
Conclusion
The highest and best use analysis for restaurant properties requires more depth than is needed for many other types of properties. As with most retail properties, a restaurant can reach the end of its economic life suddenly with the construction of an overpass that redirects traffic, the closing of a local demand generator, an unexpected health emergency, or some other significant event. In addition, though, a challenge more acute to restaurant properties is the turbulence of the businesses they house, which often operate at low margins with a perpetual influx of new competitors resulting from a low barrier of entry. Moreover, a restaurant’s original design is often best suited to its original occupant, and design standards and preferences will almost certainly evolve over the years. After also considering that restaurants are often small buildings constructed on prime commercial sites, it becomes clear that a restaurant building may only remain viable for this specialized use for far less time than the building’s physical life could accommodate. Consequently, it is important that restaurant operators, investors and advisers recognize that these properties can have a short economic life. It is also helpful to view a restaurant property’s economic life as a continuum with four distinct stages, as outlined earlier in this article. This can help with acquisition and disposition strategies, including understanding the profile of a property’s likely buyer and formulating appropriate pricing. •
Endnotes
1. Mr. Campbell’s experience includes site selection, construction, lease negotiation and property management. ↩
2. From his August 7, 2019 blog “You are Only Appraising the Real Estate?” (www.rmscommercialgroup.com/blog.php) ↩
3. D. Scott McLain, JD, CCIM, CRE is Principal and Managing Broker of Huntsville-based Coldwell Banker Commercial McLain Real Estate. He is a real estate expert with extensive experience in restaurant site selection, lease negotiation, and development. ↩
4. Mr. McLain added that many corporate users “find it easier and cheaper to re-develop than retrofit (to meet their exact kitchen specifications and other current standards). Conversely, though, he also added that local restaurateurs will often operate from the same building “for 40 years,” and that the building “looks it.” ↩
5. As a practical matter, prior to marketing a property for sale, many savvy landlords will re-negotiate or extend a lease with a short remaining term when possible. ↩
6. Beware: In some situations, sales volume tells us more about the operator than it does the real estate. ↩
7. See “Restaurant Rules of Thumb: How Does Your Operation Measure Up to Industry Averages & Standards?”, published on Restaurantowner.com ↩
8. Nationally, diners spend an average of $36.40 per person at a restaurant. New York City and Boston spend above the national average, with $46.14 and $41.54 respectively, while most of the respondents in other cities spend below it, with cities like Charlotte, San Antonio and Detroit spending the least. Source: zagat.com ↩
9. See “Restaurant Rules of Thumb: How Does Your Operation Measure Up to Industry Averages & Standards?”, published on Restaurantowner.com ↩
10. Source: Bloom Intelligence ↩
11. Mary O’Connor, ASA, CRE, CMI, CFE is an appraiser specializing in business enterprise value who often works with the real property appraisers on property tax and other matters. Ms. O’Connor has been valuing businesses for many decades, with restaurants and hospitality being a significant component of her practice. ↩
12. This purchaser is an excellent example of what Mary O’Connor, ASA, CRE, CMI, CFE would describe as a “strategic buyer.” ↩