A Case Study on Florida’s Low Income Housing Tax Credit Projects
Introduction
Last year, several hurricanes caused major damage in Houston, Florida and Puerto Rico. Now in 2018, Hurricane Florence and Hurricane Michael have wreaked havoc in the southeastern United States. Michael was the most intense landfalling U.S. hurricane since Camille in 1969. As it made landfall in the Florida panhandle, extreme winds and storm surge left homes and communities destroyed. Flooding from Michael’s heavy rain reached across the state of Florida and as far as Georgia, the Carolinas, and Virginia.
But hurricanes aren’t the sole cause of coastal flooding. The effect of sea level rise resulting from climate change is likely to cause unprecedented damage in coastal communities. Sunny day flooding is already occurring along the East Coast in cities from New York to Florida as well as in Gulf Coast communities. Even when there is no rain, the high tide and full moon cause flooding to occur due to sea level rise. Florida is particularly vulnerable because porous limestone does little to hold back seawater inundation, which is damaging to critical infrastructure. Current projections suggest Florida will have $15 billion to $23 billion of property underwater by 2050, increasing to $208 billion by the end of the century.1 The City of Miami has announced plans to spend $400 million hoping to protect its built environment and abate the notable increase in rain and tidal flooding. Given the number of subsidies and public/private investment in affordable multi-family housing, it is important to have a clear understanding of the effect of sea level rise and the storm surge risk, particularly for property built with Low Income Housing Tax Credits (LIHTC). These credits are the most significant source of funding for the production of affordable multifamily housing in the United States.
Developers who specialize in LIHTC are also good candidates to examine the costs and benefits associated with the triple bottom line of sustainability: economic, environmental, and social. For-profit and non-profit owners must maintain economic viability of affordable projects to consider participating in this niche market. At the same time, affordable rents are dependent on lower development costs and taxpayer subsidies. Affordability directly affects social and economic sustainability through rules of project compliance which, if not followed, levy hefty tax penalties on LIHTC investors. Complex rules for compliance have traditionally protected experienced companies in this niche who tend to be larger, national developers. Less experienced local competitors understand effects from changing climate conditions. Experienced developers and LIHTC management agencies well-versed in compliance are in a stronger position to effectively reduce economic risks for LIHTC development overall.2,3 However, local developers are better situated to understand risks associated with the effects of sea level rise in their local communities. In spite of company experience, compliance risk can be high for LIHTC developments due to uncontrollable natural hazards, such as sea level rise, if environmental sustainability is not taken in to account in the development process.
Efficiency in the LIHTC program is achieved through subsidies that target hard costs as opposed to soft costs typically associated with syndication and investor returns.4 However, these hard costs are likely to increase in the future once developers and policymakers recognize the need to mitigate the substantial environmental risk that is associated with sea level rise. Avoidable risk associated with environmental and social sustainability is of particular concern when policies permit LIHTC developers and owners to ignore the social impact of disaster when they develop projects on sites vulnerable to environmental hazards such as storm surge.
Real estate development has a history of equating sustainability with environmental risk. Environmental factors are a significant risk factor during the pre-development phase. After all, site selection is a sizeable pre-construction expenditure that if not thoroughly vetted could have significant ramifications in terms of social and environmental costs, ultimately affecting future operational budgets. Just how much risk is at stake is of concern to stakeholders, including taxpayers who fund LIHTC projects through tax credits and grants, insurance companies who underwrite disaster recovery alongside federal disaster efforts, and owners and users who suffer the consequences in the aftermath of disaster.
The Florida 2004 Hurricane Season
In 2004, the hurricane season began on schedule in Florida with Hurricane Charlie, a Category 4 event with storm surges of less than seven feet. Over the next six weeks, Hurricanes Frances, Ivan, and Jeanne hit the state ultimately causing severe housing damages in every county across the state. Storm surge from Hurricane Ivan reached 9 feet in northwest Florida. Hurricanes Frances and Jeanne had recorded storm surges of 8 feet and 6 feet, respectively.5
Storm surge causes considerable damage to the built environment. In Mississippi, Hurricane Katrina caused storm surge that reached 27.8 feet at Pass Christian destroying 7,500 homes and exceeding the previous storm surge record set by Hurricane Camille in 1969.6 In 2005, storm surge hit the southwest coast of Florida after Hurricane Wilma hit the shore. Three years later, storm surge preceded the landfall of Hurricane Ike 24 hours before the hurricane hit the coast of Texas.7 Storm surges can cause billions of dollars in property damage. Unfortunately, FEMA considers LIHTC and other multi-family housing concerns as operating business subjecting them to relief from the Small Business Administration, which typically results in increased debt for rehabilitation and restoration. Costs are especially important for LIHTC projects that have very tight operating budgets and can quickly run into financial difficulties if additional debt is required to fix damages from the storm surge.
Sea, Lake, and Overland Surges from Hurricanes (SLOSH) models are created to by the National Weather Service to estimate storm surge heights at given locations along the coast. GIS technology and SLOSH models have been used by others to analyze storm surge risk. CoreLogic8 studied the effect of storm surge on single-family homes and found that more than 6.5 million single-family homes with a reconstruction value of nearly $1.5 trillion were at risk of damage from storm surge in coastal communities.9 The study concurred with the Intergovernmental Panel on Climate Change10 identifying Texas and Florida as having the greatest risk of damages due to storm surge. Florida ranked highest with potentially 2.5 million homes at risk of storm surge. Estimated reconstruction costs for the state were estimated at more than $490 billion for existing homes. In a Category 5 worst-case scenario, CoreLogic estimated more than $70 billion in damages to single-family homes. The top six metropolitan areas at greatest risk of damages from storm surge are located in Florida. Miami, considered the most vulnerable, has 562,410 single-family homes potentially at risk of storm surge in every category of hurricane, which represents a reconstruction value of $103 billion.11,12 This current study is the first to examine the more specialized LIHTC sector for storm surge risk.
Using Florida as a case study, we have identified LIHTC units at risk of storm surge in two categories: a Category 3 hurricane at mean tide (C3M), and a worst-case scenario of a Category 5 hurricane at high tide (C5H). Florida produced 148,287 LIHTC units in 1,035 developments between 1987 and 2010 (Figure 1).
Figure 1: LIHTC Developments 1987-201013
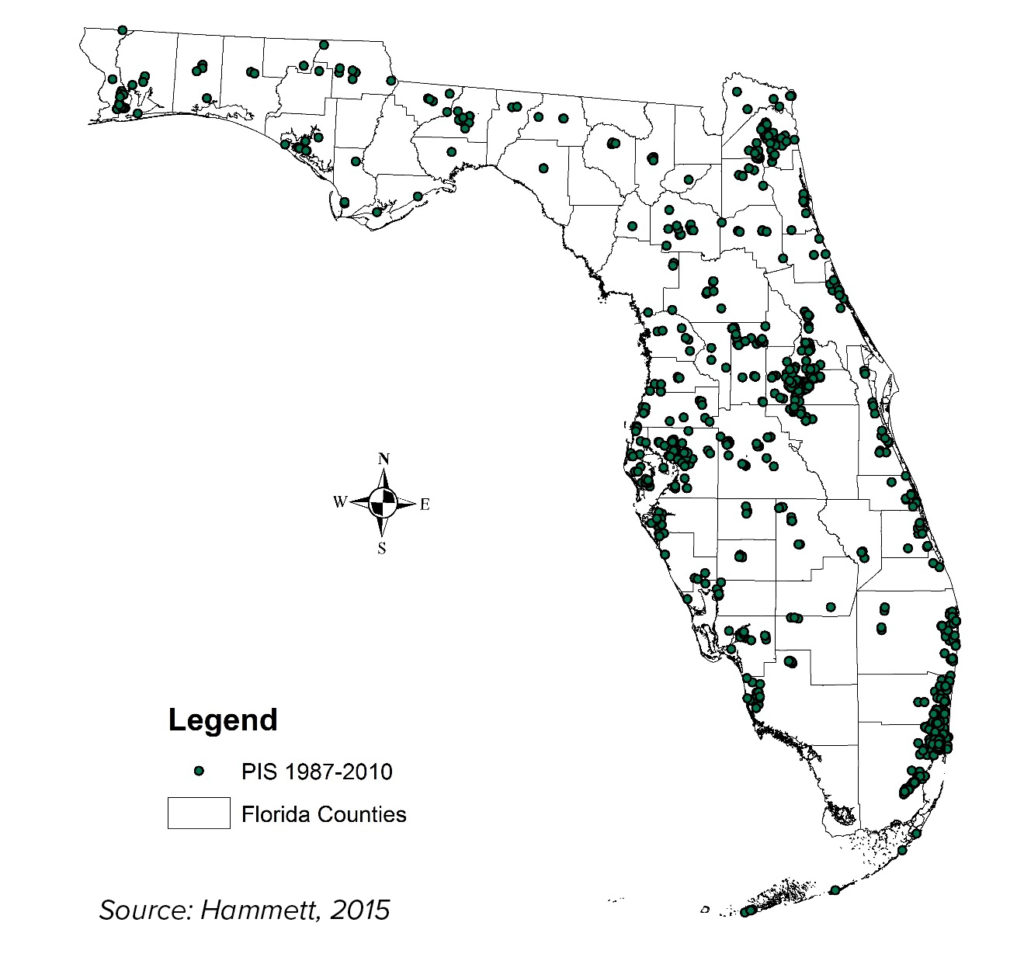
The case study first analyzed the number of units located in hazardous storm surge areas between 2005 and 2010. In 2003 and 2004, 70% of newly developed LIHTC were located in coastal counties. Considering the hurricane disaster of 2004 that caused housing damages of more than $213 billion, it seems obvious that the development community and the housing authority should consider storm surge areas when choosing sites for construction of affordable housing. However, it is clear that this is not the case as developers continued to bring LIHTC housing on line at a rapid pace in basically the same percentage on land with a high risk of storm surge before and after this catastrophic 2004 hurricane season.
Three quarters of development occurred in coastal communities to address housing based on factors including affordability, population, and demographic factors. Although social needs in coastal counties are clearly important, it is equally important to consider economic or financial risk. During the pre-construction phase, both the LIHTC developers and the Florida Housing Finance Corporation could and should have examined the financial risk by analyzing site selection as part of the approval process. These two stakeholders might be more inclined to consider storm surge for project site selection if the financial risk is severe enough to sustain losses that would alarm the public.
Geographic Information Systems (GIS) was used to identify the extent of storm surge risk that LIHTC sites could have experience based on location. Although only Florida was studied for this research, the study could be extended to other states and could be used during the project site selection stage as part of the approval process. Sites with a high probability of storm surge during hurricane season would not be viable options for funding.
Analysis of LIHTC on Sites Subject to Storm Surge
Category 3 Mean Tide (C3M)
The greatest percentage of potential losses due to a C3M storm surge existed in Monroe, Charlotte, Collier, and Lee Counties (see Appendix Table 2) in Florida. Charlotte County could experience the loss of 94% of its LIHTC housing in just an average Category 3 storm. Lee County could lose 74% of all LIHTC units in the county. Monroe County, with relatively few LIHTC units, would still experience a shock to the affordable housing stock with 98% of LIHTC units facing potential damages from a C3M storm surge.14
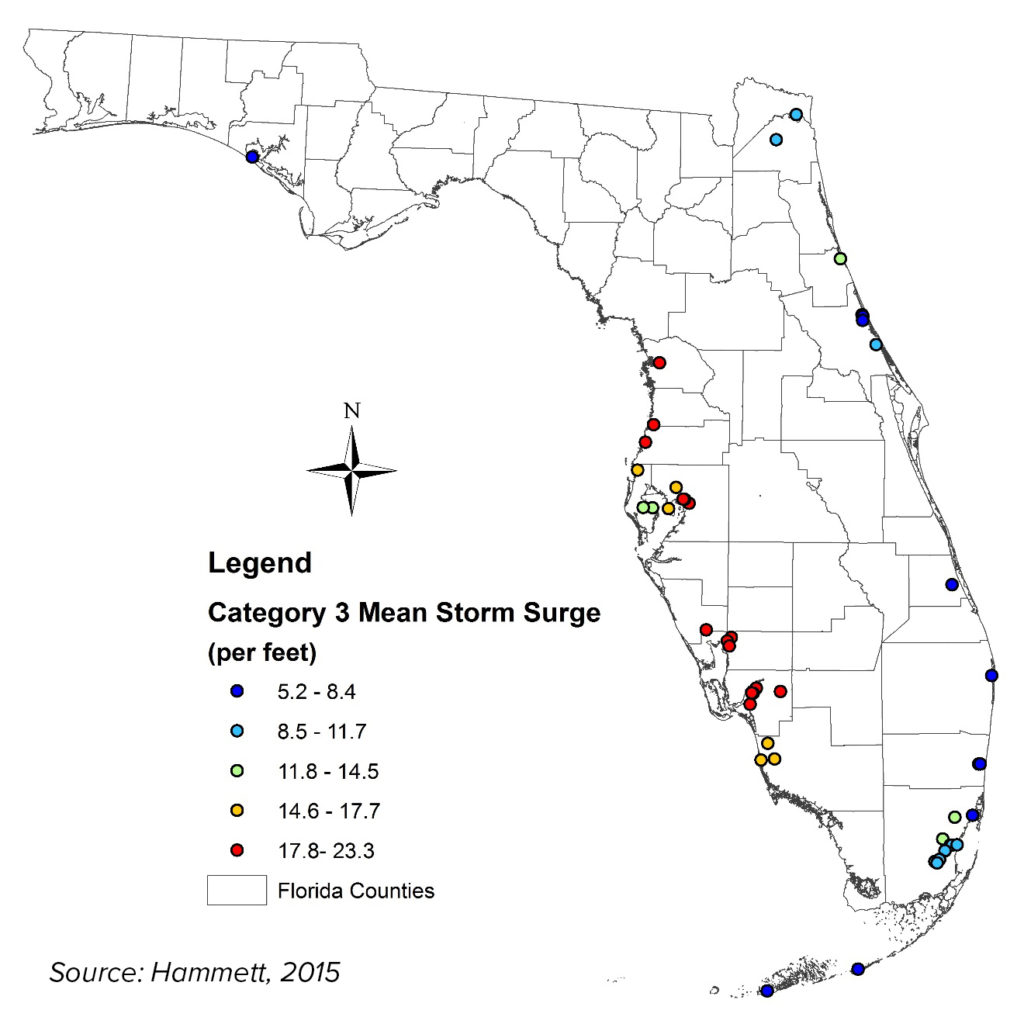
The county with the greatest number of LIHTC units located in a C3M storm surge area is Miami-Dade with 8,137 units subject to as much as a 12.8-foot storm surge. Collier County has potentially 84% of its LIHTC units in areas that would be subject to 15.8 to 17.4 feet of storm surge during an average Category 3 hurricane event. Charlotte County has 94% of LIHTC units in sites subject to storm surges of between 8.9 feet and 20.4 feet. Even though the county has just 1,399 units in total, the loss of 1,315 units would be devastating to the county and users of these properties. Of the 99,572 LIHTC units in coastal counties, 26% were subject to storm surges ranging from 5.2 feet to 23.3 feet during an average Category 3 storm at median tide (Figure 2). Storm surges could be much worse during high tide.
Figure 2: Storm Surge Height Risk for LIHTC Units from a Category 3 Hurricane at Mean Tide15
Category 5 High Tide (C5H)
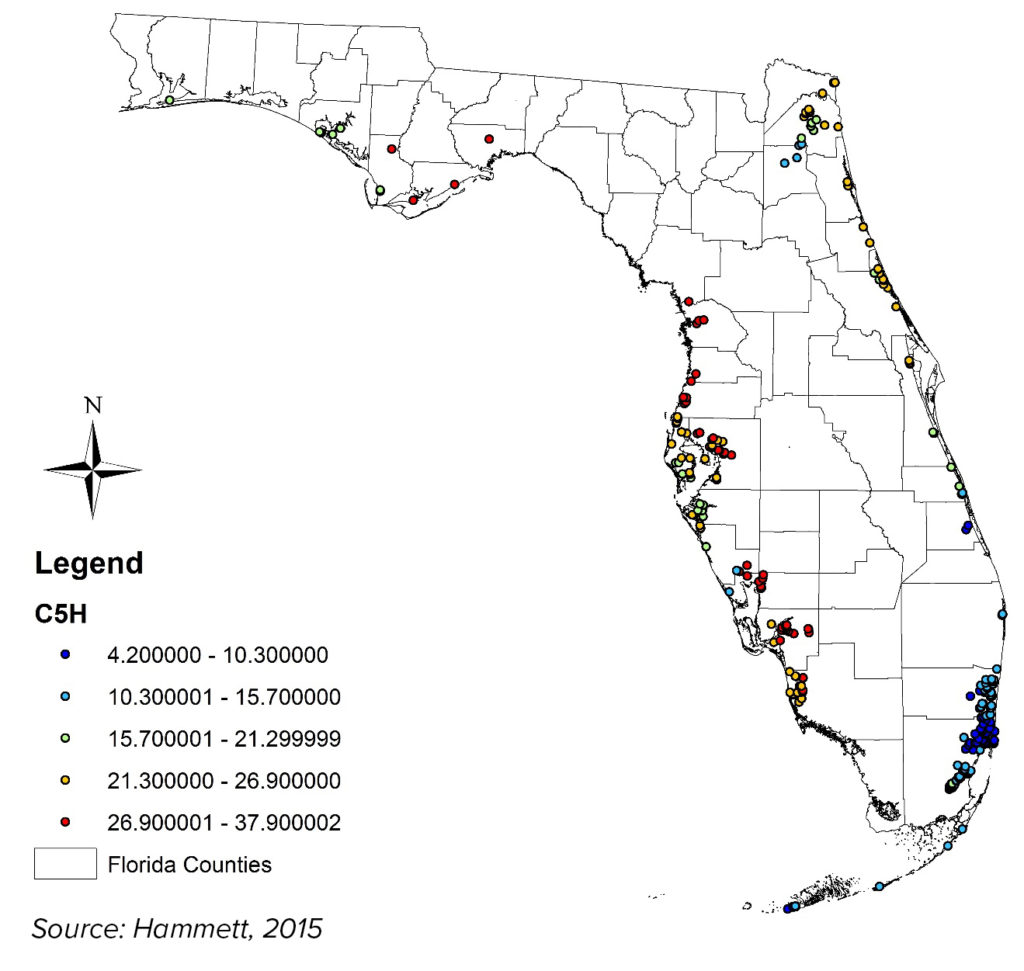
33% of all LIHTC housing stock in Florida could be damaged or destroyed (see Appendix Table 3). Charlotte and Wakulla Counties could lose virtually all of their LIHTC housing stock with surges between 14.5 feet and 35.2 feet. Three other counties face similar devastation. Monroe County risks losing 98% of LIHTC units, Lee County has 94% of its units at risk, and Collier County faces a loss of 87% of its LIHTC housing stock.16
Storm surges in these counties are high enough to sound an alarm to counties and owners with simulated ranges between 9.7 and 35.2 feet. The greatest number of units in harm’s way are located in Miami-Dade where 56% of its 23,048 units are at risk because they are located in storm surge areas that could be between 4.2 and 19.5 feet. In the case of a C5H storm, there will be no escaping location risk due to storm surges 4.2 to 37.9 feet (Figure 3).
Figure 3: Storm Surge Height Risk for LIHTC Units from a Category 5 Hurricane at High Tide17
Economic Consequences of Storm Surge for LIHTC
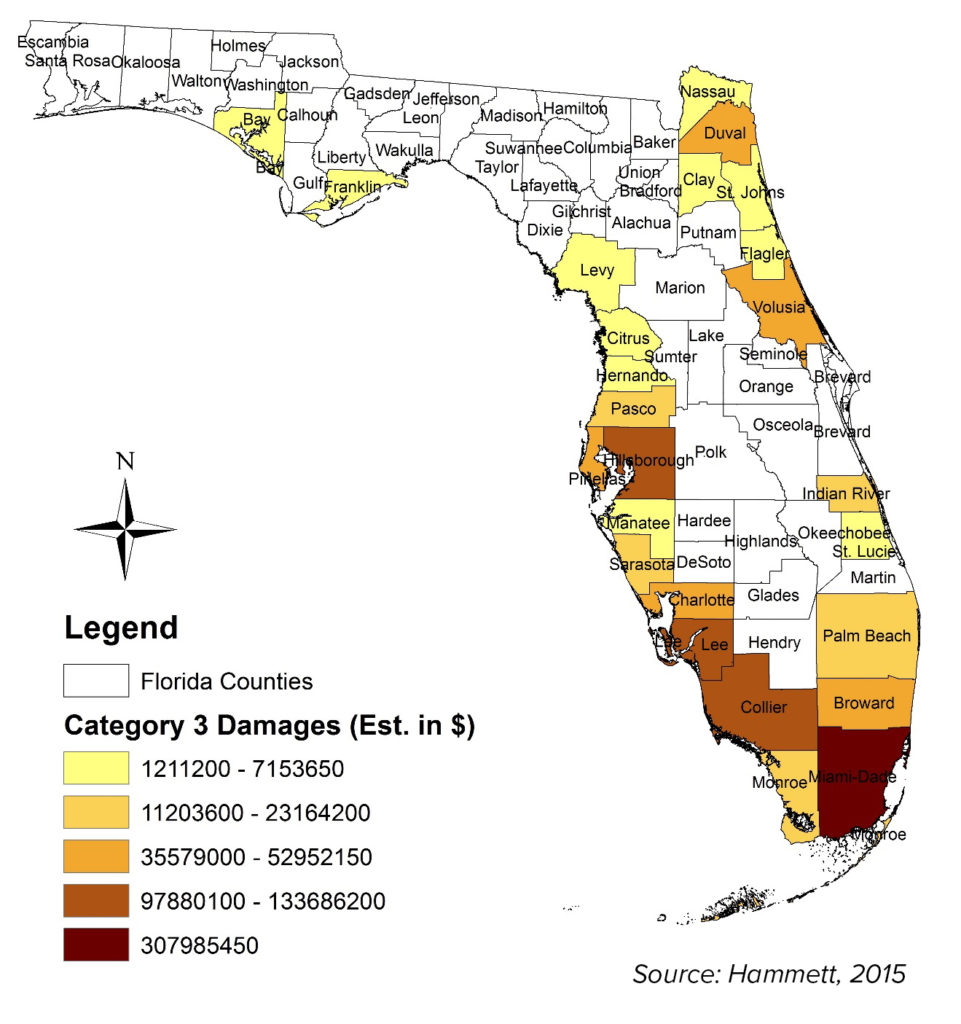
Market value, construction costs, and rehabilitation costs were considered when analyzing the potential economic loss of LIHTC units from hurricane induced storm surges. Market value was determined by analyzing arms-length transactions of sales in the southeast analyzed annually by the Marcus and Millichap’s Tax Credit Group. The average value of a single LIHTC unit in the Southeast was $34,700 per unit based on sales of 48 properties across the region. A 2014 and 2015 transaction update showed an increase in median sales price to $41,000 per unit and $45,000 per unit, respectively. These sales were used to estimate the market value per unit to calculate losses from potential damaged or destroyed units. The estimated market value of Florida LIHTC located within a Category 3 storm surge area is $988 million. Miami-Dade accounts for over 30% of total damages with a potential loss in value of $307 million. Levy County has potential value losses of $1.2 million (see Figure 4).
Figure 4: Estimated Loss of LIHTC Value from Storm Surge during a Category 3 Hurricane18
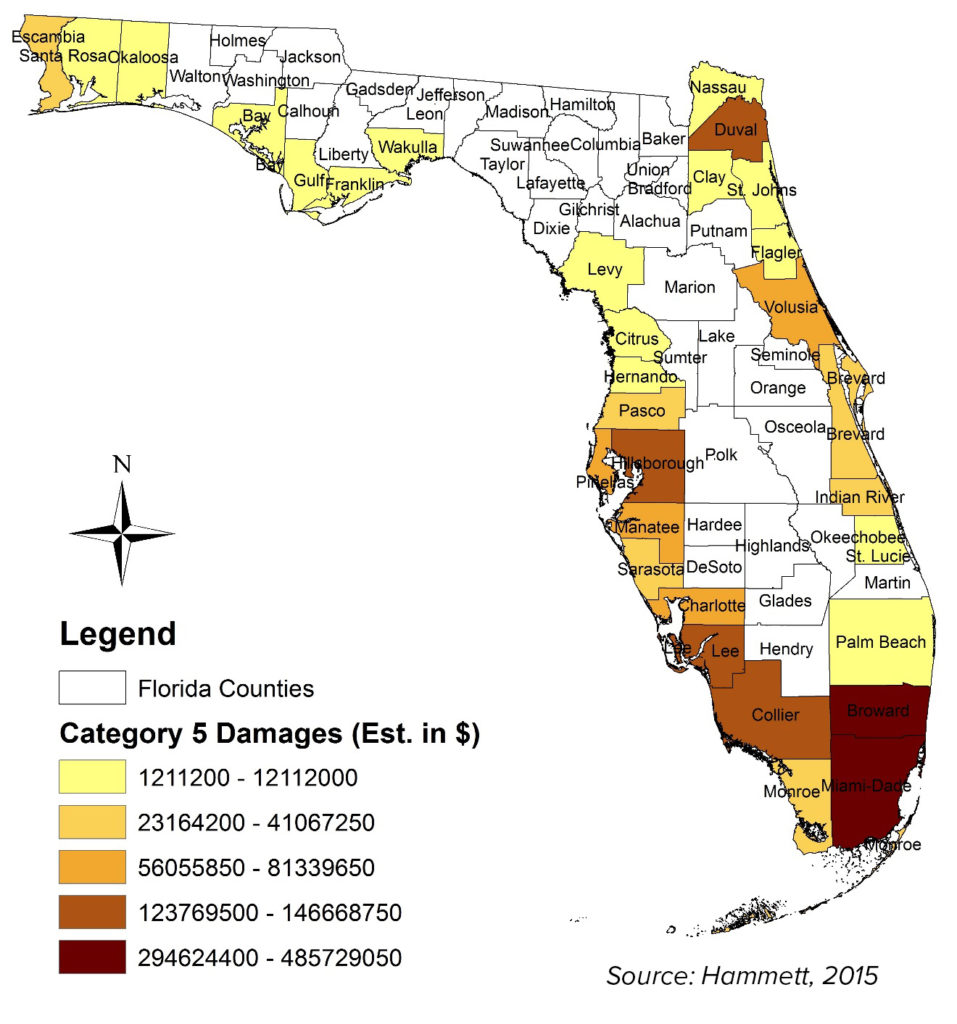
Using the same formula, the estimated market value of Florida LIHTC housing located within a Category 5 storm surge area would be $1.8 billion. Analyzing the counties, Miami-Dade would again have the highest potential value losses with close to half a billion dollars in estimated damages if all LIHTC properties needed to be rehabilitated (see Figure 5). Every coastal county analyzed faces some loss in value from a Category 5 storm. Wakulla County, which had just one LIHTC development with only 34 units, could experience a potential loss in value of $1.2 million.
Figure 5: Estimated Loss of LIHTC Value from Storm Surge during a Category 5 Hurricane19
To analyze the losses in another way, construction costs were collected from credit underwriting reports submitted to the Florida Housing Finance Corporation by the project developers between April 2014 and January 2017 (see Appendix Table 4).
The average construction cost of new LIHTC units was $89,472. Rehab units averaged $32,249. Costs did not include entrepreneurial profit, construction or rehab of recreational amenities and leasing offices, site work, or contingencies. New construction costs and rehabilitation construction costs were applied to units within the hazardous storm surge boundaries. Estimated rehabilitation costs from a C3M storm were more than $877 million statewide. New construction to replace units exceeded $2 billion. In a C5H storm, rehab costs was greater than $1.6 billion while replacement with new construction was over $4 billion that would be required from public and private sources. Again, FEMA typically classifies multi-family housing projects as business entities. As a result, disaster relief is only provided through the Small Business Administration with low interest loans. FEMA does not offer individual assistance grants to businesses of this type. Keep in mind that most property insurance is exempt from flood events.
Conclusion
This case study demonstrated the importance but also the difficulty in trying to estimate the market value as well as the costs to replace or rehabilitate properties that have a significant potential to be damaged or destroyed by a hurricane disaster in coastal communities.
Regardless of the method used, even counties with the least percentage of economic losses would be severely affected by the number of affordable units taken offline from the storm surge damage.
Proactive measures during the pre-construction approval phase can insure site selection will consider the potential for storm surges. Technology exists to determine how specific sites are likely to experience storm surges allowing developers to design projects in ways that mitigate potential damages. From a policy perspective, it would behoove local government to consider site design and potential storm surge damages when considering site approval for LIHTC projects. The onus is also on state housing authorities to weigh how imminent sea level rise is likely to increase storm surge risk when projects are considered for tax credit awards.
As detailed in this study, existing LIHTC projects are also subject to significant financial risk that deserves some consideration for mitigation and adaptation strategies. Owners should take proactive steps to increase capital reserves that would support techniques such as construction of artificial barriers and physical defenses from storm surge and hurricane effects. Non-structural solutions such as natural vegetation and wide buffers can also be implemented.
Finally, coastal developers need to understand that the risk of disaster is not “if”, but “when”. Therefore projects need to be underwritten with a substantial set-aside to address the inevitable “rainy day”.
Endnotes |
|
| 1. Gordon, K. (2014). Risky business: The economic risks of climate change in the United States. Risky Business Project. ↩
2. Clancy, P. E. 1990. Tax incentives and federal housing programs: Proposed principles for the 1990s. In D. DiPasquale & L. C. Keyes (Eds.), Building foundations: Housing and federal policy (Chapter 11). Philadelphia: University of Philadelphia Press. ↩ 3. Stegman, Michael A. 1991. The Excessive Costs of Creative Finance: Growing Inefficiencies in the Production of Low-Income Housing. Housing Policy Debate, 2(2):357–73. ↩ 4. Ibid. ↩ 5. Verdi, R.J., 2005, Hydrologic Effects of the 2004 Hurricane Season in Northwest Florida: U.S. Geological Survey Open-File Report 2005-1277, 18p ↩ 6. Fritz HM, Blount C, Sokoloski R, Singleton J, Fuggle A, McAdoo BG, Moore A, Grass C, Tate B (2008) Hurricane Katrina storm surge reconnaissance. J Geotech Geoenviron Eng, ASCE 134(5):644–656. ↩ 7. Kennedy, A.B., Gravois, U., Zachry, B.C., Westerink, J.J., Hope, M.E., Dietrich, J.C., Powell, M.D., Cox, A.T., Luettich, R.A. and Dean, R.G., 2011. Origin of the Hurricane Ike forerunner surge. Geophysical Research Letters, 38(8). ↩ |
8. CoreLogic, 2011. Annual Storm Surge Report, 2011: Residential Storm Surge Exposure Estimates for 10 U.S. Cities, CoreLogic. ↩
9. Botts, H., Du, W., Jeffery, T., Suhr, L. 2014. 2014 CoreLogic Storm Surge Report. July 2014. ↩ 10. Intergovernmental Panel on Climate Change. http://www.ipcc.ch/ ↩11. Botts, H., Du, W., Jeffery, T., Suhr, L. 2014. 2014 CoreLogic Storm Surge Report. July 2014. ↩ 12. CoreLogic, 2011. Annual Storm Surge Report, 2011: Residential Storm Surge Exposure Estimates for 10 U.S. Cities, CoreLogic ↩ 13. Hammett, V. L. (2015). Risk analysis and disaster recovery: A Florida LIHTC case study (Doctoral dissertation, Clemson University). ↩ 14. Worzala, Elaine M. and Hammett, V. L. (2017) Post-Disaster Recovery for Real Estate Development: An Analysis of Multifamily Investment from the Perspective of a Low Income Housing Tax Credit (LIHTC) Project. (G. Squires, E. Heurkens, and R. Peiser, ed.) Routledge Companion to Real Estate Development. Routledge: New York. ↩ 15. Hammett supra note 13. ↩ 16. Worzala and Hammett supra note 14. ↩ 17. Hammett supra note 13. ↩ 18. Ibid. ↩ 19. Ibid. ↩ |
Appendix – Real Estate Issues – The Devastating Impact of Storm Surge on Coastal Communities


 Photo: johnmoorefour/Shutterstock.com


