 @Trong Nguyen/shutterstock.com

The Global Housing Shortage was listed as the #3 Issue in the 2023-24 Top Ten Issues Affecting Real Estate® by The Counselors of Real Estate®.
Make no mistake: The housing shortage persists. That said, the influx of new apartment supply is causing a mass deceleration of rent growth, overall, and even rent declines in markets with significant new construction. The law of supply and demand, in its finest form, is working.
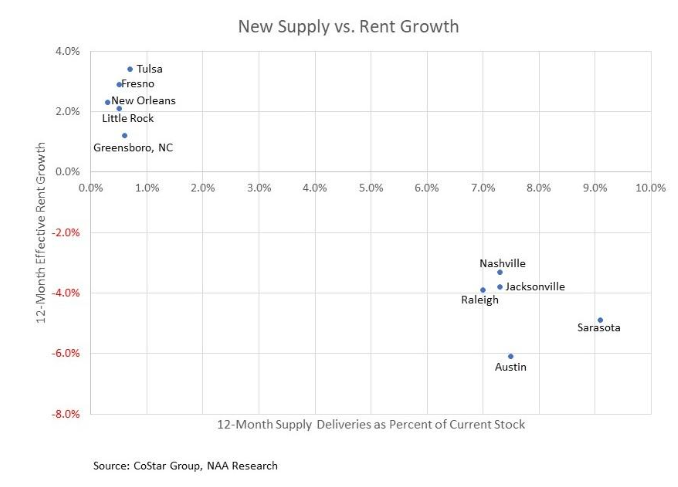
Nationally, over 550,000 units were delivered during the past 12 months, according to data from CoStar. That’s just under 3% of the current apartment stock. Of the 82 markets tracked by CoStar, 35 experienced supply additions greater than the national average. The top five and bottom five markets for new supply are shown in the chart below. Those with the greatest amount of new construction saw rent declines, while those with minimal new construction saw rent growth, albeit moderate. To be clear, this is not the case for all 82 markets, but generally speaking, more supply in the face of demand that is at the very least flat, equals rent declines or rent moderation. Two anomalies are San Francisco and San Jose, Calif., still reeling from remote work pandemic trends. They were sixth and seventh for the least new supply, with new units comprising less than 1% of the inventory, yet still sustained slight rent declines. On the flip side, Madison, Wisc., delivered over 4,000 units this past year, about 6% of its inventory, but rents increased by a relatively healthy 4.1%. One only needs to look at the vacancy rate to understand why: At 4.2%, it is the sixth lowest in the country and well below the double-digit vacancy rates of the top five markets for new supply.
According to U.S. Census data, multifamily construction completions in 2023 are on track to be at their highest level since 1987, but we are not even close to having enough supply. Housing of all types needs to be located where people want to live, and it needs to come at all price points. Due to the increased costs for new construction, from materials to labor to land to capital, it is not feasible to build affordable housing without plenty of subsidies. More than two-thirds of this year’s deliveries came at the higher end, that is, 4- and 5-star properties. Just 9% were classified as “affordable,” with an average market rent per unit of $1,297. As far as location, nearly half of all new construction in 2023 can be found in just 12 metro areas. Vacancy rates remain below 5% in some of the largest metro areas in the country: New York, 2.6%; its New Jersey suburbs, 4.5%; and Los Angeles at 4.9%. Add to that the decades of underbuilding, and a few years of solid construction just barely makes a dent in the housing shortage.
It’s important to note that while rents are softening, market dynamics take time to play out, so affordability remains a problem in many areas of the country. Of the 58 markets that the National Apartment Association (NAA) tracks in its Affordability Watch, just 15 have showed improvement in rent-to-income ratios, declining for two quarters or more in 2023. Of these, 14 have either vacancy or construction rates well above the national average, underscoring the importance of new supply in helping to ease affordability constraints.
Turning to single-family, the supply situation is even worse. Through November, completions are on track to be on par with the 2022 level of 1 million units. While this is in line with long-term averages, it falls far short of the breakneck pace of new construction leading up to the Global Financial Crisis. From 2000-2007, single-family completions averaged 1.4 million units per year.
In the 2010s, this figure dropped precipitously for all types of housing units combined. For the entire decade, the U.S. added fewer than 9.2 million housing units while the economy pumped out nearly 24 million new jobs. Contrast that to the 1970s’ 19.5 million jobs and 17 million housing units, and it’s no wonder that supply continues to undercut demand, leading to record low levels of affordability.
The for-sale market witnessed its fair share of ups and downs in 2023. The Case-Shiller Home Price Index began to decline during the second half of 2022 and into 2023, dropping 2.5%. Prices started increasing again in February and have done so for eight consecutive months, rising 4.8% during that time and surpassing the peak in June 2022. The National Association of Realtors’ (NAR) median price of an existing home had been following a similar pattern but diverged in recent months. It also peaked in June 2022 at $413,800 before declining to $361,200 in January. Prices then inched up for five months, never getting back to peak, and have been on the decline for the past five months. Still, as of November, prices have risen 18% since the beginning of 2021.
Consequently, the NAR Affordability Index sank to new lows this year, with the October preliminary estimate at 91.4. A reading of 100 means that a family at median income makes just enough to qualify for a loan for a median-priced home. The index has been below 100 for six consecutive months.
Some relief has been seen in the inventory of existing homes, which increased steadily over the last half of 2023, and currently stands at 3.7 months of supply. It still pales compared to the long-term average of five to six months. Elevated mortgage rates are not only keeping prospective buyers on the sidelines; they’re also keeping sellers at bay. According to Redfin, 62% of homeowners have mortgage rates below 4% and more than 80% locked in a rate below 5%. While rates have been trending downward for the past two months, they still averaged 6.7% for the week of Dec. 21, 2023. Unless a homeowner is forced to sell due to a life event, mortgage rates have a long way to go before sellers feel comfortable enough getting back into the market.
Prices for new homes began trending downward in 2023, both a supply and demand side phenomenon. Relatively healthy levels of new construction coupled with muted demand as mortgage rates hit their highest level in decades resulted in softer market conditions, ultimately requiring builders to reduce prices and offer concessions.
What’s ahead for 2024? Well, we already know that both single-family and multifamily permits and starts are down through November, on average, compared to the same time last year. Forecasts for single-family starts are widely dispersed with Fannie Mae forecasting a 4.5% decline, while the Mortgage Bankers Association (MBA) sees an 11% increase. The forecasts for multifamily starts are clearer cut, with many analysts and economists anticipating a decline, some as steep as 28% (MBA) while Moody’s Analytics is calling for a 13% dip. On a three-month moving average, starts have been declining for seven months, and with starts to completions averaging 17 months for properties with five or more units, we could start seeing completions decline as soon as Q3 2024. However, several private sector data firms are forecasting apartment completions to peak in 2024, so we may well have another strong year for new supply before market forces step in and work their way towards equilibrium.
Discounted rents amid new supply have and will absolutely open more options for renters, but many middle-income households still struggle to find affordable options close to work or school. The Workforce Housing Tax Credit, which was introduced into the House and Senate in December 2023, would build on the success of the Low-Income Housing Tax Credit by including moderate-income households struggling with housing costs. The Choice in Affordable Housing Act, introduced this past summer, targets lower-income renters who need better access to support systems. The legislation aims to increase voluntary private sector participation in the Section 8 Housing Choice Voucher program. Affordability is a complex issue that can’t be solved through market dynamics alone, but they can certainly move the needle in the right direction.