 Photo: MIND AND I/Shutterstock.com
Introduction
Anyone following the housing market understands that inventories of existing homes have continued to shrink, time on the market has never been faster, and often reasonably priced homes sell in one day. Add to this a huge reduction in labor-intensive on-site visits replaced by detailed video tours and a portfolio of photos, and the average buyer can much more efficiently whittle their list of potential home candidates to a much smaller list than was the case a decade ago. Information on the history of the home, past selling prices along with school quality and crime rates and other information typically provided by neighborhood brokers, has become ubiquitous and free of charge.1 Meanwhile, home prices have far outpaced the rate of inflation for many years, raising the real costs of a percentage-based commission charged to buyers and sellers. Commission rates in less developed countries like Russia have significantly fallen, along with the proliferation of technology. This all begs the question: Why haven’t we seen a decrease in the price of brokerage services in the U.S.? Below is an update on research from two decades ago, along with some descriptive current market trends on home prices and time to sell.
Background on Brokerage Fees Charged in the U.S. and Around the World
Fees in the Year 2000 with a nascent internet: One of the approaches to evaluate what is a competitive agency fee for buying a home is to examine fees charged around the world at developed (technologically advanced) and even at less developed countries. This builds off the original work on brokerage fees collected around the year 2000, presented in “How do US Residential Brokerage Trends & Fees Compare to the Rest of the World?”2
According to NAR (National Association of REALTORS®) some 37% of all buyers used the internet to search for homes in the year 2000, a trend we knew would accelerate over time. At this time, the typical fees in developed countries were 2, 3, 4 and 5%. For example, Singapore was 2%, the United Kingdom was 2%. Denmark, Belgium, Italy and Japan were at 3%, and Greece and Israel were at 4%, Spain and Canada and Sweden averaged 5%. Less developed and technologically inefficient countries like South Africa and Mexico were at 7.5% and Russia, Belarus, were at 10% on average. The U.S. averaged 6.5% at the time, for total fees, with 3% typically paid to buyer’s agents. A graph of the commission fees charged by country versus the GDP per capita (as a measure of economic productivity) suggested the U.S. was an outlier in 2000. Typically, agents in lower fee countries like the UK made as much income or more, as those in the U.S. but were much more productive in terms of handling far more transactions than typical agents in the U.S. Our research conclusions at the time were as follows: “As traditional brokerage firms (in the U.S.) use more automated services and expert systems to serve consumers…they will become more efficient…the cost of full-service agents should decline to 5% or so within a decade and possibly as low as 2% within the next two decades, provided the fees charged in other developed countries are a reliable indicator.” Note that this conclusion was the total fee for both the seller’s agents and the buyer’s agents, if any. To estimate the buyer’s fee, if any, we would have concluded any fee for a buyer’s agent could be approximately half this amount or less, 2.5% in 2010 and about 1% in 2020, based again on the fees charged in other countries and the knowledge that search costs were becoming more efficient via the internet.
Prior research helped to explain the conformity of fees, but not the high rates compared to other countries. The explanation goes like this: No real estate agent can enter the industry without becoming an apprentice or sub-agent to an existing broker. That is, to become a broker, licensed to sell real estate, one must first become an agent. For example, in Missouri, an individual that wants to become a broker must pass a 48-hour course, and be active for at least 24 of 30 months prior to taking the brokerage exam. This two-year-plus activity requirement results in no real estate agent being able to innovate or compete on fees, without first becoming part of the existing establishment. Once an active agent is part of the existing industry, they will realize that listing agents are dependent on buyer’s agents and vice versa. Frequent interaction with agent peers and an awareness of dependency for future referrals, results in no newer agents being able to buck the pricing system too hard, without the risk of losing sales based on buyer’s agents steering buyers away from listings that charge less than the going rate.
Steering as the enforcement mechanism prevents price cutting behaviors: This steering behavior away from price cutter firms has been well established in numerous Antitrust symposiums, such as the one held November 8, 2005, in Washington D.C.3 All of the presentations in this symposium provided evidence of steering, and the strong influence of the Multiple Listing Service (MLS) run by the various REALTOR® associations across the U.S. While some authors suggested outright collusion by the real estate industry, many agreed that the current system allows subtle and difficult to detect steering, along with some implicit agreement to imitative pricing, at least on the buyer’s agent side. A more recent study documented and confirmed such findings. In a paper by Panle Jia Barwick, Parag A. Pathak, and Maisy Wong in 2017, entitled “Conflicts of Interest and Steering in Residential Brokerage.” Published in the American Economic Journal: Applied Economics, they summarize their findings as follows:
“This paper documents uniformity in real estate commission rates offered to buyers’ agents using 653,475 residential listings in eastern Massachusetts from 1998–2011. Properties listed with lower commission rates experience less favorable transaction outcomes: they are less likely to sell…. These adverse outcomes reflect decreased willingness of buyers’ agents to intermediate low commission properties (steering), rather than heterogeneous seller preferences or reduced effort of listing agents. The negative outcomes for low(er) commissions provide empirical support for regulatory concerns over steering.” 4
A survey of brokerage fees around the world in 2015 by the Wall Street Journal provided somewhat of an update on brokerage fees around the globe. The authors were particularly interested in the question of whether technology was bringing down brokerage fees as had occurred in stock brokerage fees, and air travel booking fees.5 What was interesting is that in many less developed countries, fees had dropped significantly. For example, fees in Russia and Belarus were reduced from 10% or 10.5% to 2% on the seller side, with no agent on the buyer side. China went from 7.5% to 2.0%, Finland went from 4% to 2%, Australia went from 2.5% to 2.0%. This confirms the notion that in competitive markets, technology has aided in brokerage efficiencies and fees have generally come down.
Figure 1: Typical Residential Commissions Around the World
|
Country |
Total |
Seller Com rate |
Buyer Com Rate |
Avg Home Price in U.S. Dollars Midyear 2020 |
Comment or Notes |
|
Denmark |
0.5-3% |
2 |
0 |
$330,000 |
2002: 2%-4% commission. Buyer pays 25% of sale price transfer tax; advertising provided by real-estate agent. |
|
2015: 1%-3% paid by the seller |
|||||
|
Netherlands |
1-3.5% |
2 |
1.5 |
$385,280 |
Buyers do not always have agents. |
|
Hong Kong |
2% |
1 |
1 |
$1,200,000 |
2002: One agent may deal with both the buyer and seller. Commission increased since 2002. |
|
2015: After introduction of buyer’s agent, 1% paid by seller and 1% paid by the buyer |
|||||
|
UK |
1.5-2.5% |
1.5 |
1 |
$292,140 |
Usually paid by Seller and split between Agents |
|
Sweden |
1.5 -5% |
2.7 |
0 |
$340,000 |
2002: 5% paid by seller. Higher commission charged for lower-priced units |
|
2015: 1%-2% paid by the seller. 1.5% till 3% in Stockholm and 4-5% in the countryside. |
|||||
|
Singapore |
2% |
1 |
1 |
$874,372 |
Usually Buyer’s Agent will co-broker and share commission with Seller’s Agent |
|
Australia |
2-4% |
2 |
1.5 |
$558,450 |
Buyers commission depends on option of the agency agreement, can start from $300 fixed up to 2% of the total price |
|
Belgium |
2.5-3.5% |
3 |
0 |
$293,659 |
No buyer commission |
|
Finland |
3-4% |
3.5 |
0 |
$280,000 |
In 2002: Fees ran to about 5% of the sale price on condos, and 3%-4% on single-family homes. More expensive homes have lower commission fees. The government collects a value added tax (22% of the selling price). |
|
2015 to present: 2% paid by the seller, up to |
|||||
|
Russia |
4% |
2 |
2 |
$149,000 |
2-4% or fixed $500 to $2,500 depending on services. The average home price is only based on two largest cities |
|
Norway |
1.5-2% |
1.8 |
0 |
$412,900 |
2002: 2%-3%. Broker represents both parties in the transaction, 2015 – 1.5%-2% paid by the seller. |
|
USA |
4-6% |
3 |
3 |
$288,000 |
Typical seller commission is 1% to 3%, but the buyer’s commission is uniformly 3%. Most typical sum is 6% of the price of the home. |
A survey of brokerage fees in the first quarter of 2020 was conducted for a sample of countries and summarized in Figure 1 and graphed in Figure 2. We note that in most urban areas and among developed nations the commissions typically run 2% to 4% with the bulk of that paid to seller’s agents. Buyer’s agents are not always utilized, but when they are the fees tend to run 1% to 1.5% of the sales price.6 This is in contrast to the U.S, where the total commissions run 4% to 6%, and the buyer’s agents remain fairly uniform at 3%. We do note that seller’s agents’ fees in the U.S. have fallen somewhat since our original survey in 2000, with more discount fee firms like Redfin, surviving and charging only 1% to list a property for sale. Such firms would have likely been steered away from, prior to a widespread listing system like Zillow or Trulia that made it impossible to avoid showing such homes to buyers.
Figure 2: Typical Residential Commission Rates Around the World in 2020
Typical Commission Rates By Country As % of Price, Broken Down By Seller/Buyer, with total and buyer fee noted
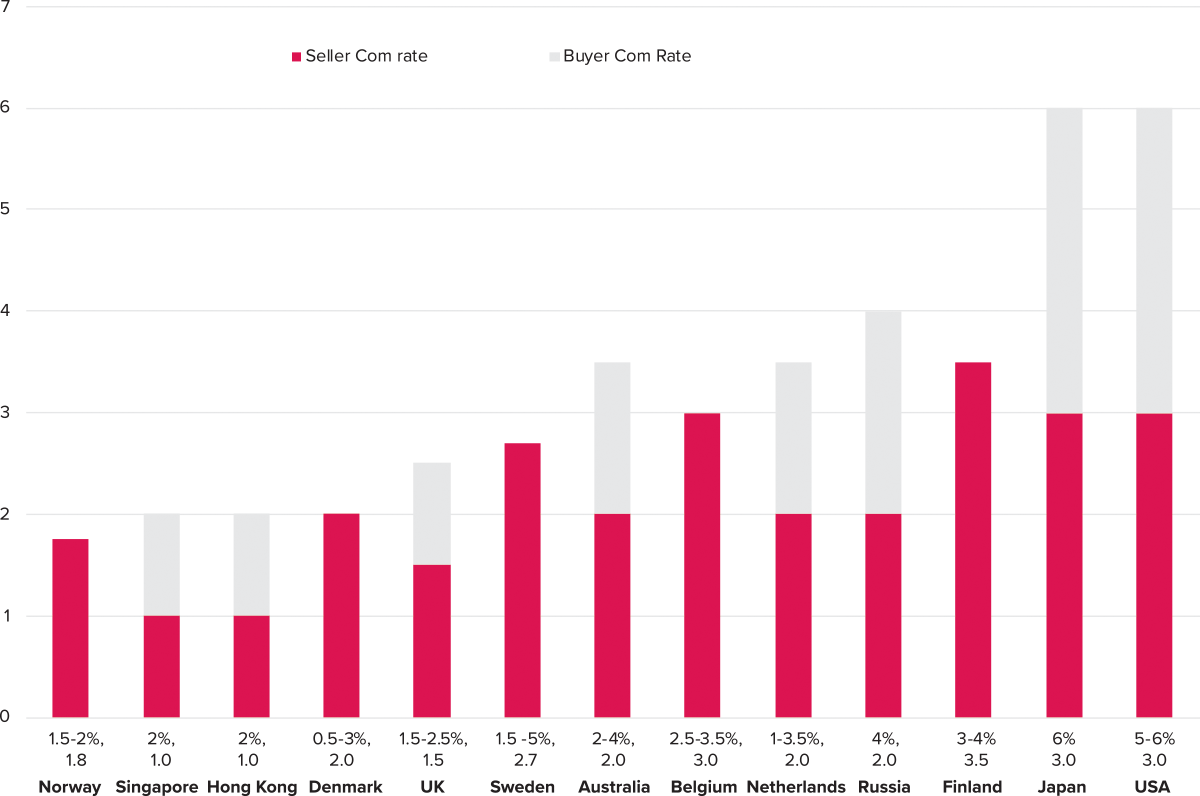
Globally brokerage fees have dropped over time: What is most noticeable is the significant drop in brokerage fees in three highly developed countries, Finland, Denmark and Sweden, and in Russia, a less developed country. In Russia, fees dropped from 10% or so to less than half that, mostly as a result of utilizing technology. In these three more developed countries (Finland, Denmark, Sweden), we notice significant home price increases, and also the impact of technology, both of which, in a competitive market, explain the drop in brokerage rates, to about half the former prices, for brokerage services. Adjusted for inflation in home prices, the real commission rates dropped slightly less than half.
Even the National Association of REALTORS® (NAR) research suggests that technology should erode brokerage fees: A 2015 report from NAR entitled “D.A.N.G.E.R.” reflects the potential for price competition among brokerage firms.7 In this report they note that the need for agents to play the role of matchmaker is declining with technology, and the lower fees in other countries reflect this trend. They also note the damaging impact of marginal agents, where many people have a real estate license, but really don’t have any competence. They use the license to benefit from friends and relatives that are buying or selling a home. Such agents do only 20% of the business while representing 80% of the licensees. These marginal agents have entered the industry because of the ease of entry and they hurt the reputation of the professional agents. The report also noted that Zillow and other websites like FSBO.com, owners.com, ListByOwnerinMLS.com, BuyerCurious.com, 10Realty.com and SalebyOwnerRealty.com threaten the industry, in that buyers can now find their own homes.
How Difficult is it to Sell a Home?
Aside from the common knowledge that home search is easier today compared to prior decades based on online search systems with photos and videos, and archives on the price history of most properties, one possible indication of market efficiency is suggested by the average time on the market of homes that have sold. While this does not provide concrete information on buyer search time, it does suggest that the matching process between buyers and sellers is more efficient in 2020 than say in 2010 and has been coming down. Note that in hot markets of 2005 and 2006 time on the market was fairly brisk, but then the market crashed when over leverage in the housing market could not sustain prices. Below are four representative metro markets shown from 2005 through the end of August 2020. In 2005, we were in the midst of a housing price surge and very lax mortgage underwriting which led to the subsequent housing crash in 2008-2010. The period since 2010 may be more representative than the brisk market of 2005, but this is as far back as we can show for the selected markets in Figure 3.
Figure 3: Time on the Market Prior to Sale in Four Metro Markets
Average Time on the Market in Days to Sell by Year
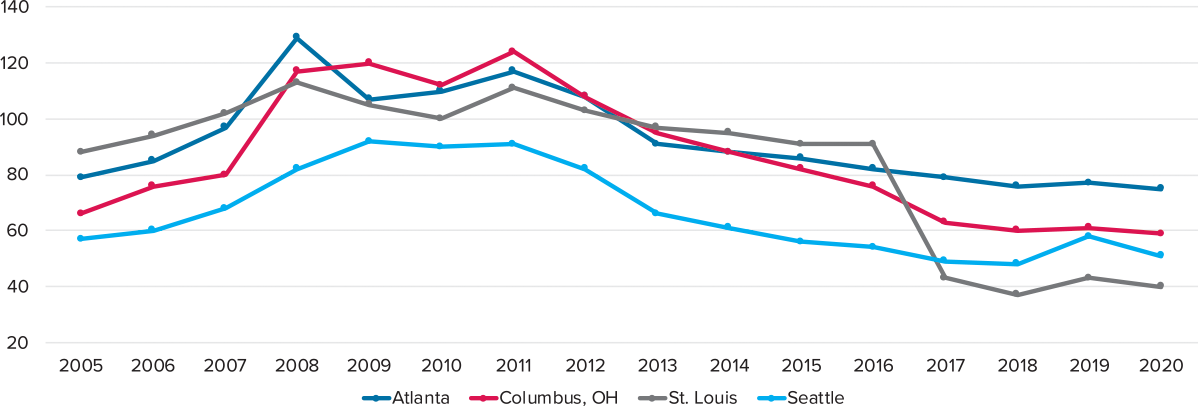
Data Source: Collateral Analytics
While the matching of buyers and sellers has become more efficient and the time on the market has generally been falling since 2010, why have brokerage fees not fallen as a competitive method to derive more business? The answer goes back to that 2015 NAR report, noting that whereby the industry is filled with marginal producers who enter into the industry via a required apprentice system and develop relationships with other agents. Those agents that are more successful are also more dependent on other agents. Yet, when prices are rising more than inflation, and the time on the market is declining, would not the profit margin for agents be increasing and real wages going up as well? The answer would be “Yes” were it not for the pie being split up by more and more agents. This is indicated by the long term trends provided by comparing NAR membership to the U.S. population. We observe that as real estate prices increased relative to inflation, and the profitability of making a home sale increased for agents, the number of agents going after the same pie resulted in far more real estate agents in the U.S. than in any other developed country.
|
Year |
NAR |
U.S. |
Population/REALTORS |
|
1920 |
10,000 |
106,461,000 |
10,646 |
|
1948 |
40,000 |
146,631,302 |
3,666 |
|
1975 |
250,000 |
215,973,199 |
864 |
|
2019 |
1,400,000 |
329,064,917 |
235 |
There are 2 million licensed real estate agents in the U.S. as of 2019 (NARELLO) and 1.4 million REALTORS (NAR) and an adult working population of 156,920,000 in the U.S. with 130,597,000 working full time, above aged 16 or over. Using the NAR license figure to reflect more active license holders, we have approximately 1% of all working adults with a license to sell real estate. Just looking at the figures above from 1975 through 2019 suggests an increase in the number of NAR members by 560% while the population increased by 53%. With some 5.5 million homes sales per year in the U.S., the average agent sells no more than 3 homes per year, or 6 or 7 sales if you consider two sides to many transactions. Obviously, many license holders are working less than full time in the industry and tainting the professionalism of the industry. To the extent that full-time professionals are engaged, and doing the bulk of the transactions, the productivity of the marginal agents is even less.
Conclusions
It is clear that in competitive markets we should observe brokerage fees that vary over time in relationship to the real cost of the service, and in those non-U.S. markets where prices have greatly exceeded inflation, we have observed lower agent fees. Fees should also increase in markets where prices are falling. Rather than witnessing fees adjusting to any of these factors, in the U.S. we observe the supply of agents entering the industry increases inversely with the effort required to sell a home. This results in a large number of less competent licenses, who are less active and less experienced than real full-time agents.
Brokerage firms engaged in residential sales in the U.S., for the most part, resist competing openly on price, especially buyer’s agents. Keep in mind that in the U.S., the total of buyer and seller commissions are generally paid via sellers, as opposed to being paid directly by buyers and sellers separately. Seller’s, with advice from agents, tend to offer consistent going rates, in order not to deter agent influenced buyer interest and steering away from discounted fees listings. This agent interdependency and resistance to competing on price would likely break down if buyers and sellers paid fees directly, and without revealing the fees in a Multiple Listing System. The problem with this imitative and uniform pricing and refusal to dare to break the status quo rates, on buyer’s commissions in particular, is that it brings many incompetent and unproductive agents into the industry who see it as entitlement for having a license and having relatives or friends that buy homes on occasion. On the seller’s side, where full-time professional agents tend to focus, we do see more price competition and variation starting to emerge.
We note that fees do vary by price and complexity within the more complex commercial real estate industry. Ease of entry may be similar, in terms of securing a license, but the educational requirements to succeed are far higher. That may result in sufficient barriers to entry by less professional candidates, than observed in residential real estate.
One would expect the U.S. residential brokerage rates to be more in line with advanced economies like Sweden, Finland, Norway, or at worst case, like those in Australia, the UK, Israel, Singapore where sellers pay 1 or 2% and buyer fees run 1 or 2%. A competitive real estate brokerage industry would result in a much more productive and professional set of agents representing buyers and sellers and society would be well served to reduce the number of licenses dabbling in the industry. Residential agents could earn as much as they do today or more, but with lower fees and far more productivity per agent. •
The author thanks Polina Makarenko for research assistance for this study.
Do you disagree with the author’s conclusion? Have a different opinion or point of view? Please share your thoughts with REI, or better yet prepare and submit a manuscript for publication by emailing the Real Estate Issues Executive Editor (or Board) on this article to rei@cre.org.
Endnotes
1. Free from sites such as https://www.Zillow.com, https://www.neighborhoodscout.com, and https://www.adt.com/crime ↩
2. Delcoure, N and N. Miller, 2001, “How do U.S. Residential Brokerage Trends and Fees Compare to the rest of the World?”, Real Estate Issues, 26:3. ↩
3. Norman Hawker was the organizer of the 2005 conference, see https://www.antitrustinstitute.org/people/norman-hawker/. ↩
4. Barwick, Pathak and Wong, 2017, “Conflicts of Interest and Steering in Residential Brokerage” American Economic Journal: Applied Economics, 9:3, 191-222. https://www.aeaweb.org/articles?id=10.1257/app.20160214 ↩
5. Wall Street Journal, “Real Estate Commissions Around the World” 2015, See https://graphics.wsj.com/table/commish_1016. ↩
6. Apparently, buyers represent themselves and trust seller’s agents sufficiently to draft a mutually agreeable contract. There is no widespread evidence of abuse of this arrangement in countries where buyers are not formally represented. Some may view this as dual agency, but it is not represented that way. Colleagues in Sweden and the Netherlands explained that buyers are sophisticated and educated enough to represent themselves. ↩
7. NAR D.A.N.G.E.R. Report Available at https://store.realtor.org/product/report/danger-report ↩