 Photo: katjen/Shutterstock.com
Institutional investors historically have been relatively slow to embrace public real estate1 as a significant part of their allocation to real estate. Real estate allocations of most pension funds and other institutions are overwhelmingly, and in many cases entirely, invested in private real estate vehicles such as open-end funds, closed-end funds, joint ventures, and separate accounts. But have these large institutions been remiss in their reluctance to invest in public real estate? More importantly, has this been a conscious decision or simply a lack of action due to inertia?
In the first section of this article we examine (i) reasons why institutions have generally declined to utilize REITs; (ii) recent studies that may help lessen concerns over the correlation characteristics and volatility of public real estate; and (iii) the growth of the overall public real estate investment market and its emergence as a new industry class. In the second section, we discuss what including REITs as part of a real estate allocation could mean for institutional investors. We conclude that there are powerful arguments for institutional investors to re-examine any long-standing views they have regarding investment in public real estate.
The Changing Characteristics of Public Real Estate
Traditional Concerns
When the topic of public real estate has arisen over the past 25 years, the primary concerns of many real estate investment officers have been: a) the volatility of public real estate is much greater than private real estate, and b) the returns of public real estate are more closely correlated with the stock market than they are with real estate. It is also worthwhile to note that many investment officers at pension plans and their counterparts at consulting firms first worked in the private real estate world, and thus would be more comfortable sticking with structures with which they have had direct experience.
A Tabular Look at the Evolution of Public Real Estate
The characteristics of public real estate have changed greatly in recent years, as highlighted below in a table showing the US REIT market’s evolution over the past decade (see Figure 1).
Figure 1: How U.S. REITs Have Changed |
||
|---|---|---|
2007 |
Mid-2017 |
|
| Market Size (1) | $438 Billion | $ 1.1 Trillion |
| Average REIT Size (1) | $2.9 Billion | $5.2 Billion |
| Liquidity (2) | $4.1 Billion a day | $7.2 Billion a day |
| Volatility of REIT Returns (3) | Believed to be much higher than Private Real Estate | Evidence suggests volatility is more similar to Private Real Estate |
| REIT Correlation to Stocks (3) | Believed to be much higher than Private Real Estate | Evidence suggests correlation is more similar to Private Real Estate |
| REIT Correlation to Private Real Estate (3) | Believed to be low | New evidence and methodologies indicate high |
| Property Sectors (4) | Traditional “Four Main” sectors dominated | Healthcare sector is larger than Office; Storage similar in size to Industrial |
| GICS/S&P Industry Classification | Part of “Financials” with banks and insurance companies | “Real Estate” became its own industry sector in 2016 |
| REIT Exchange-Traded Funds (ETFs) | Few existed, and small in size | 20+ ETFs; largest has $63 Billion AUM |
| Cost to Invest | Separate accounts charged fees of between 50 and 75 bps | Major ETFs charge fees as low as 7 to 12 bps |
| (1) FTSE NAREIT All REITs equity market capitalization, Year-End 2006 and July 2017. (2) Average daily trading volume, July 2007 versus July 2017. (3) See discussion of CEM Benchmarking study and Figures 2 and 3. (4) See Figure 5 for a comparison of REIT property sectors to NFI-ODCE weights. |
||
| Sources: NAREIT, CEM Benchmarking, Bloomberg, Bard Consulting LLC | ||
Correlation
The cornerstone of investment theory is to maximize returns while minimizing risk, and the benefits of increasing diversification to optimize a portfolio’s risk/return characteristics are well known.2 If public real estate acts much more like stocks than private real estate does, it does not help an institutional investor reduce risk across an efficient portfolio, no matter what benefit may accrue from greater liquidity or higher potential returns than private real estate offers. But perhaps the most important criticism against public real estate has been the view that its returns are highly correlated to the stock market; much more so than private real estate returns.
Correlation of returns is an easy metric for investors and their consultants to analyze, and historically public real estate has been viewed as having roughly 50-80% correlation to stocks while private real estate has a 10% to 20% correlation to stocks.3 To set one historical benchmark, a research paper by the Pension Real Estate Association in 2010 concluded that public real estate was “more closely related to equities, corporate bonds and hedge funds than … private real estate”, noting the correlation of the Russell 3000 to private real estate was only 0.18 versus 0.59 for public real estate over the Q2 1994 to Q2 2010 time period, and the correlation between public and private real estate was a low 0.24.4 Thus, it has been easy to argue that public real estate does not fully deliver the diversification sought when making real estate investments.
But the devil is in the details. Although the real property assets owned within the public and private real estate “wrappers” are largely similar, dissimilarities of the two investment vehicles include property sector mix, geographic mix, leverage ratios, and most importantly, the substantial difference in return measurement methodology. Real estate equities are valued daily by stock market prices compared with the appraisal or “transaction-based” valuation methods of private real estate.
Real estate practitioners and various academic studies have long argued that much of the difference in volatility and correlation can be substantially explained by factors such as (i) appraisal smoothing, (ii) lags in reporting (compounded by the fact that individual real estate funds have significantly different reporting lags), and (iii) the frequency of valuations. In fact, in 2005 a widely-cited paper5 compared public and private real estate return data but controlled for three key differences: property-type mix, leverage and appraisal smoothing. The study concluded that the resulting data series were similar, and that they “suggest a seamless real estate market in which public- and private-market vehicles display a long-run synchronicity”.
As shown in the upper portion of Figure 2, CEM Benchmarking Inc.’s 2016 study found the “as reported” correlation of large cap US stocks to private real estate to be only 0.08 versus a 0.54 correlation between large cap US stocks and public real estate over the from 1998 through 2014.6
Figure 2: Correlations, 1998-2014Red figures show the effects of delagging and unsmoothing of private real estate returns |
|||||
|---|---|---|---|---|---|
I. Using Pre-Standardized Private Real Estate Returns |
US Stocks |
Fixed Income |
Real Estate |
||
| Large Cap | Small Cap | US Long Bonds | Private | Public* | |
| US Large Cap Stocks | 1.00 | 0.92 | -0.50 | 0.08 | 0.54 |
| US Small Cap Stocks | 0.92 | 1.00 | -0.62 | 0.01 | 0.63 |
| US Long Bonds | -0.50 | 0.62 | 1.0 | 0.03 | -0.07 |
| Private Real Estate | 0.08 | 0.01 | 0.03 | 1.0 | 0.09 |
| Public Real Estate * | 0.54 | 0.63 | -0.07 | 0.09 | 1.0 |
II. Using Standardized Private Real Estate Returns ** |
US Stocks |
Fixed Income |
Real Estate |
||
| US Large Cap Stocks | 1.0 | 0.92 | -0.50 | 0.49 | 0.54 |
| US Small Cap Stocks | 0.92 | 1.0 | -0.62 | 0.57 | 0.63 |
| US Long Bonds | -0.50 | -0.62 | 1.0 | -0.11 | -0.07 |
| Private Real Estate | 0.49 | 0.57 | -0.11 | 1.0 | 0.91 |
| Public Real Estate * | 0.54 | 0.63 | -0.07 | 0.91 | 1.0 |
| * Public Real Estate is Listed Equity REITs ** Private Real Estate returns are “standardized” through a delagging calculation by CEM Benchmarking |
|||||
| Source: CEM Benchmarking, June 2016 | |||||
However, CEM also utilized a new methodology to “standardize” public and private real estate returns. Using their database of nearly 200 private real estate funds, CEM calculated the time lag that best fit the pattern of each funds’ historic returns versus a de-levered public real estate benchmark. CEM found that the return data for private real estate funds most commonly lags public real estate returns by either six to eight months, or 14 to 16 months depending upon the fund. Using the individually calculated time lags, CEM then shifted each of the approximately 200 funds’ return histories forward, and recalculated the overall private real estate return history. This “standardized” data, shown in the bottom half of Figure 2, resulted in a pattern of historic returns that are nearly identical for both vehicles and demonstrates a very high correlation of 0.91 between public and private real estate.
While it is too soon to say if the academic community (and, perhaps more importantly, institutional investors and their consultants) will accept and embrace the results of the new CEM methodology, the study certainly reinforces the growing body of work that points to correlation not being a major issue, if viewed through a mindset that is accepting of well-known reporting differences. However, it needs to be noted that if the concept of “standardizing” private real estate returns becomes accepted, there is a legitimate question as to how institutional real estate investors and their consultants can utilize one type of return data for reporting purposes while using a modified version for asset allocation or other strategic purposes.
Volatility
Most real estate investors agree that public real estate acts more like stocks in the short run but more like real estate in the long run. However, the high short-term volatility of public real estate can be as problematic as the correlation issues discussed above, as asset allocation studies utilize expected risk, as measured in terms of volatility, to help determine the efficient frontier for portfolio construction.
Once again let’s examine how thinking on volatility can differ depending on how it is measured. For historical purposes, note that the Pension Real Estate Association’s 2010 research paper found public real estate to have a relatively high volatility of 11.37% compared with only 3.58% for private real estate over the Q2 1994 to Q2 2010 time period. However, as shown in Figure 3, when private real estate returns were “standardized” in the new CEM Benchmarking study, the volatility of both public and private real estate appear to be very similar, even when measured over several different time periods. It is also worth mentioning that the volatility of public real estate decreases if measured over longer periods of time (such as a year or longer), rather than the daily, monthly or quarterly volatility that is often reported.
Figure 3: Annualized Volatility by Time Span, 1998-2014 (percent)Using Standardized Private Real Estate Returns* |
|||||
|---|---|---|---|---|---|
US Stocks |
Fixed Income |
Real Estate |
|||
| Time Span | Large Cap | Small Cap | US Long Bonds | Private | Public** |
| 1998-2014 (17 years) | 18.7 | 21.5 | 9.6 | 19.0 | 20.7 |
| 2000-2014 (15 years) | 19.1 | 21.4 | 9.2 | 19.4 | 20.9 |
| 2005-2014 (10 years) | 18.8 | 20.9 | 10.8 | 20.9 | 22.5 |
| 2010-2014 (5 years) | 10.6 | 15.2 | 11.6 | 12.2 | 11.8 |
| 2012-2014 (3 years) | 9.3 | 14.3 | 12.2 | 11.5 | 10.8 |
| * Private Real Estate returns are “standardized” through a delagging calculation by CEM Benchmarking ** Public Real Estate is Listed Equity REITs |
|||||
| Source: CEM Benchmarking, June 2016 | |||||
In A Class of its Own
Reporting differences aside, perhaps the biggest reason for the reduced volatility and improved correlations of public real estate is the simple fact that the industry has “grown up”. The US REIT market has dramatically increased in size over the past two decades – in terms of total equity market capitalization as well as the average size of the individual companies and in daily liquidity (see Figure 4). Such a dramatic change in size naturally results in many changed relationships.
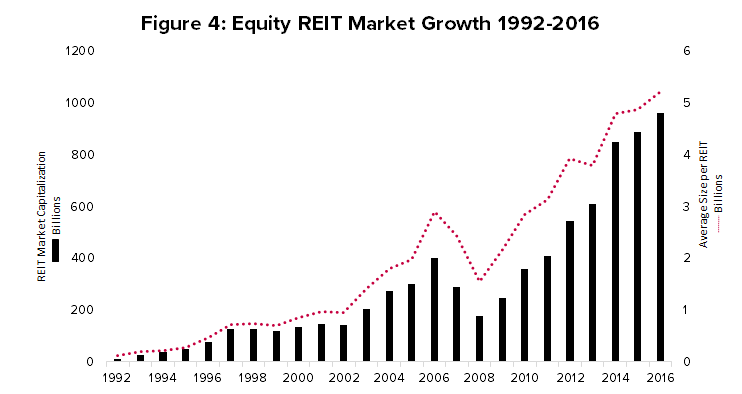
Prior to 1991, the US REIT market was heavily skewed toward mortgage lending REITs, with very few large equity REITs. The so-called “Modern REIT Era” started in 1991-1992 with the initial public offerings of several equity REITs and the introduction of new “UPREIT” regulations. These new rules permitted the issuance of REIT shares, with favorable tax treatments, in exchange for properties and helped kick-start rapid growth for what was only a $11 billion industry in 1992 – about 1% of its current size.
The addition of REITs to the S&P 500 Index in 2001 further increased their acceptance by the broad investment community. Public real estate suffered a severe drop in returns (and market capitalization) during the Global Financial Crisis in 2008-2009 but growth has been positive in the aftermath of this shock. The ability of nearly all the public real estate companies to withstand this test and deliver very attractive returns in the years subsequent has helped propel the size of the public real estate industry to over $1.1 trillion in 2017. As shown earlier in Figure 1, this rapid growth has also greatly increased the liquidity of public real estate, with average daily trading volume exceeding $7 billion in recent months. Given this increased size and liquidity, it is little wonder that the relationship of the public real estate market to the wider stock market is different today than it was 10 or 20 years ago.
Partly in recognition that it shares many of the defining characteristics of private real estate investments, public real estate became its own “top tier” General Industry Classification System (GICS) sector in September 2016. The GICS system was created in 1999 by MSCI and the S&P Dow Jones Indices to organize stocks by industry sector for the purpose of measuring performance. This move is especially noteworthy as it is the first new “top-tier” industry sector added since the establishment of the system. Previously included with Financials, public real estate’s designation as the 11th distinct industry sector reflects not only its rapid growth in size and importance but also its performance divergence from other sub-sectors in the Financials category, such as banks or insurance companies.
We believe the new GICS real estate industry designation will help spur more institutional investors to consider using public real estate, and perhaps at the marginal expense of capital that would otherwise have been allocated to private real estate.7
An Institutional Perspective
Although the total real estate allocation of institutional investors is predominantly weighted toward private real estate, many plans do include public real estate as part of their real estate strategy. In fact, Citigroup Global Markets Inc. estimates that institutional investors hold about 24% of the total investable public real estate market capitalization – although this estimate includes public real estate investments that are held as part of overall equity allocations.8
Notable investors that include REITs as part of their real estate allocation include state pension plans in Florida, Idaho, Maryland, Massachusetts, New Jersey, New Mexico, Oregon and Virginia. Cities and counties are also active public real estate investors, including Sacramento County and the city of San Diego.
As an example, the New York State Teachers Retirement System had 20% of its total real estate allocation in public real estate in 2016, representing $2.4 billion. It utilized four specialist managers to access a variety of investment strategies, with some dating back to 1995. Other plans, such as the New Jersey Division of Investments, choose to manage their public real estate investments internally. Some plans may choose a passive or benchmark-focused approach, while others seek managers that might outperform through active management.
Benefits of Public Real Estate
Now let’s examine what including REITs can add as part of an institutional real estate allocation.
- Liquidity: Public real estate’s primary difference from private real estate is that it is comprised of publicly traded securities (generally common stocks, or stocks held in mutual funds) that can be bought or sold on a daily basis. With a recent average daily trading volume of about $7 billion, public real estate offers excellent liquidity in a sector characterized by relatively illiquid private real estate vehicles.
- Transparency: Public companies are subject to high levels of federal regulation as well as facing intense scrutiny by sell-side analysts and professional investors.
- Alignment of Interest: Management and staff of public real estate companies usually own significant numbers of shares in their companies. They may also receive incentive compensation which can be at least partially tied to performance metrics like total shareholder returns.
- Investment Scalability: The ability to quickly scale public real estate investments to literally any size is a unique attribute that allows institutional investors great flexibility in fulfilling or changing investment allocations.
- Sector or Regional Specialists: Most public real estate companies are run by management teams with a high degree of focus, expertise or specialization. While this is also true of some private real estate managers, there are very few generalists still operating in the public real estate world.
- Stable Capital Base: Public real estate companies are infinite life vehicles that are subject to neither investor redemptions nor liquidation timetables. There is never any pressure to sell assets to make payouts to investors or return capital, unless it is deemed beneficial by the shareholders or management. This stability can provide management teams with the flexibility and certainty that may be needed during difficult times, such as the financial crisis of 2008-2009.
- Economies of Scale: The huge size of the public real estate market can be partly attributed to its strong performance in both absolute and relative terms over the past 20 years. Part of this outperformance might be due to operating efficiencies that large public real estate companies can achieve through economies of scale. These efficiencies, in turn, can help enhance portfolio-level income returns and total performance.
A Deeper Look at Economies of Scale
Many property types can be managed with lower marginal operating expenses as a portfolio’s size increases. Property managers should be able to negotiate more favorable service contracts, purchase supplies in greater quantities (and at presumably cheaper prices), and spread corporate overhead costs over a greater number of similar assets. While similar cost savings may also be achieved by private real estate managers, the scale of many public real estate sector specialists can be very accretive. Imagine the cost savings accruing to Public Storage from bulk purchasing of its signature orange and white paint scheme, standardized on over 150 million square feet throughout the country!
In addition to operating costs savings, sector specialists in the public real estate universe can also benefit from superior revenue-enhancing opportunities as they grow in scale. While there is not much ‘monopolistic’ pricing power accruing to owners of large, national portfolios of office or apartment properties, there is certainly a benefit from owning very large portfolios of regional malls and self-storage assets. This power is manifested by the likes of Simon Property Group, which owns 108 US malls and another 72 outlet centers, totaling over 124 million square feet, with an estimated gross asset value of over $110 billion. Simon’s malls make up a high proportion of the nation’s stock of Class A malls, giving the company tremendous negotiating power when dealing with retail tenants on new leases, renewals and creating a superior tenant mix.
Superior financing and a reduction in perceived risk are two additional benefits that may also accrue to owners of large portfolios of specialty sectors such as healthcare and net lease properties. Small portfolios of these asset types are often difficult to operate and finance effectively. Tenant defaults and releasing risk have been effectively minimized by such public real estate giants as Ventas, which owns about $32 billion of healthcare properties (mostly senior housing and medical offices) and Realty Income Corporation, which owns 81 million square feet of net leased properties. These large companies, and many of their public real estate peers, have received credit ratings from agencies like Moody’s and Standard & Poor’s and are able to issue unsecured bonds and other forms of corporate debt on very attractive terms.
Benchmarking and Performance
For institutions ready to invest a portion of their real estate allocation in public real estate securities, the issues surrounding benchmarks are particularly important. Institutional investors gauge the relative performance of their investment vehicles (in terms of both returns and risk) against appropriate benchmarks or indices. Selecting a suitable benchmark is an important decision in order to judge if an investment type, investment strategy or even the individual investment manager is meeting market expectations, is “beating the market”, or is lagging behind?
As discussed earlier, academic studies can theoretically show that the adjusted returns of public and private real estate vehicles have been very similar over time. However, unadjusted (“as- reported”) returns will no doubt continue to show a higher level of variation. Thus, judging the relative performance of a public real estate investment by using a benchmark suitable for a private real estate fund would certainly cause much confusion for the investment staff that must interpret and report performance to its board.
An institution that currently has its real estate allocation solely invested in private real estate will thus probably need to modify its benchmark, although this doesn’t have to be overly difficult. Most US-based institutional investors in private real estate utilize one or more of the benchmarks offered by NCREIF9, such as the National Property Index (“NPI”) or the Open-End Diversified Core Equity index (“NFI-ODCE”). Several institutions that have decided to also invest in public real estate have simply adopted a weighted or “blended” approach to benchmarking, which is a very common practice for tracking equity and bond portfolios with differing investment attributes. For instance, the real estate program of the Iowa Public Employees’ Retirement System utilizes a weighted benchmark comprised of 75% NFI-ODCE and 25% the Wilshire REIT Index – and these weights match the targeted split between private and public real estate within its overall real estate allocation. The Virginia Retirement System takes a similar approach, using an 85% weight to NFI-ODCE and 15% to the FTSE/EPRA NAREIT Developed REIT Index for its “Total Real Estate Benchmark”.
An Intriguing Application
The tremendous growth in public real estate market capitalization has included a significant broadening of property types or sectors represented in the REIT universe. In addition to the well-established property types (office, industrial, apartment and retail) that make up the great bulk of private real estate investments, public real estate can provide greater access to specialty sectors such as healthcare properties, self-storage, student housing, lodging, data centers and net leased assets. See Figure 5 for a side-by-side comparison of property-sector weightings in private real estate, as represented by NFI-ODCE, and public real estate.
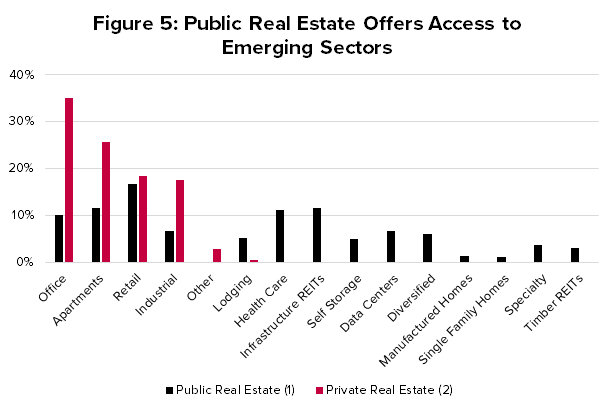
(1) Public Real Estate is represented by the FTSE NAREIT All Equity REIT index at June 30, 2017
(2) Private Real Estate is represented by the NFI ODCE index at March 31, 2017
Sources: NCREIF, FTSE Russell and Bard Consulting LLC
To underscore the greater accessibility of “specialty sectors” via investing in public real estate, consider that the “specialty” property types comprise only 4% of NFI-ODCE but make up 55% of the FTSE NAREIT All Equity REIT Index, and equate to a market capitalization of about $540 billion – over three times as large as the entire equity capitalization of NFI-ODCE!
Drilling down further, there are even subsectors such as senior housing or medical office buildings within the healthcare sector, or single-family homes for rent and manufactured housing within residential. In recent years, the scope of REIT investments has also broadened to include related real assets such as infrastructure, private prisons, billboards and timber. While outside the scope of this article, these sectors may also be of interest to investment officers within an overall “real assets” allocation.
We believe there are several intriguing ways institutional investors can utilize the public real estate market to enhance their access to specific property sectors. Rather than investing in an index fund, an ETF, or hiring a manager to create a general portfolio of public real estate companies, a “completion portfolio” of public real estate securities can be constructed to fill gaps in a desired property-type or regional allocations, either temporarily or permanently.
For example, many institutional investors may have difficulty finding private real estate managers than can effectively acquire regional malls or large logistics facilities. Regional malls can be easily accessed by creating a portfolio that includes all or some of the eight public companies that specialize in these assets, and together have a market capitalization of approximately $100 billion. Similarly, the industrial property sector comprises eleven public real estate companies with a market capitalization of about $67 billion.
In addition to completion portfolios, institutional investors may wish to broaden their portfolios beyond the four major property sectors. Public real estate offers an excellent and efficient way to gain access to self-storage, lodging, student housing, manufactured housing, senior housing, medical office buildings and many other sectors. As discussed earlier, many public real estate companies operating in these specialty sectors are run by experienced specialists – thus bringing hard-to-find expertise to the table along with nearly instant access to difficult to find niche sector opportunities.
Endnotes
1. The term “public real estate” is used herein to mean real estate securities that are listed and freely-traded on stock exchanges; most of which are Real Estate Investment Trusts (REITs) but may also include other real estate operating companies. Non-listed, private and/or non-traded REITs are not included in this definition. Except as noted, this article focuses on domestic US real estate. ↩
2. Greenwich Associates. Real Assets: An Increasingly Central Role in Institutional Portfolios (2014). Retrieved from https://www.greenwich.com/asset-management/real-assets-increasingly-central-role-institutional-portfolios.
In its 2014 study, Real Assets: An Increasingly Central Role in Institutional Portfolios, Greenwich Associates found that 90% of investment consultants and 84% of plan sponsors it surveyed cited diversification as a reason behind their decision to invest in real assets; this was the most often-cited reason, ahead of inflation protection, growth/capital appreciation, income and “other”. ↩
3. Correlations may vary greatly depending on what time period is being measured. Ibbotson Associates in its “Portfolio Diversification Through REITs” research presentation in 2006 found equity REIT correlations to large and small stocks of approximately 60-80% during much of the 1970s and 1980s. This figure dropped to between 30% and 55% during the 1990s. ↩
4. Pension Real Estate Association Research Report, REITs and Real Estate: Is There Room for Both in a Portfolio? (Hartford, 2010). ↩
5. Joseph L. Pagliari, Jr., Kevin A Scherer and Richard T. Monopoli, Public Versus Private Real Estate Equities: A More Refined, Long-Term Comparison, in Real Estate Economics, 2005 V33. ↩
6. Alexander D. Beath, PhD and Chris Flynn, CFA, Asset Allocation and Fund Performance of Defined Benefit Pension Funds in the United States, 1998-2014, CEM Benchmarking Inc. (Toronto, 2016) ↩
7. For more on this topic, see “A Big Shift: the impact of GICS changes on institutional investment in real estate” McGowan and Schneiderman (IREI Americas, September 2016 edition). ↩
8. See “Us and Them – Passive Type Products Increasing Share: A Deep Dive Look at REIT Ownership and Recent Trends”, Citi Research, September 2016. ↩
9. National Council of Real Estate Investment Fiduciaries. NCREIF’s mission statement sums up the vital role it plays for private real estate investors: “NCREIF is a member-driven, not-for-profit association that improves private real estate investment industry knowledge by providing transparent and consistent data, performance measurement, analytics, standards and education”. See www.ncreif.org ↩