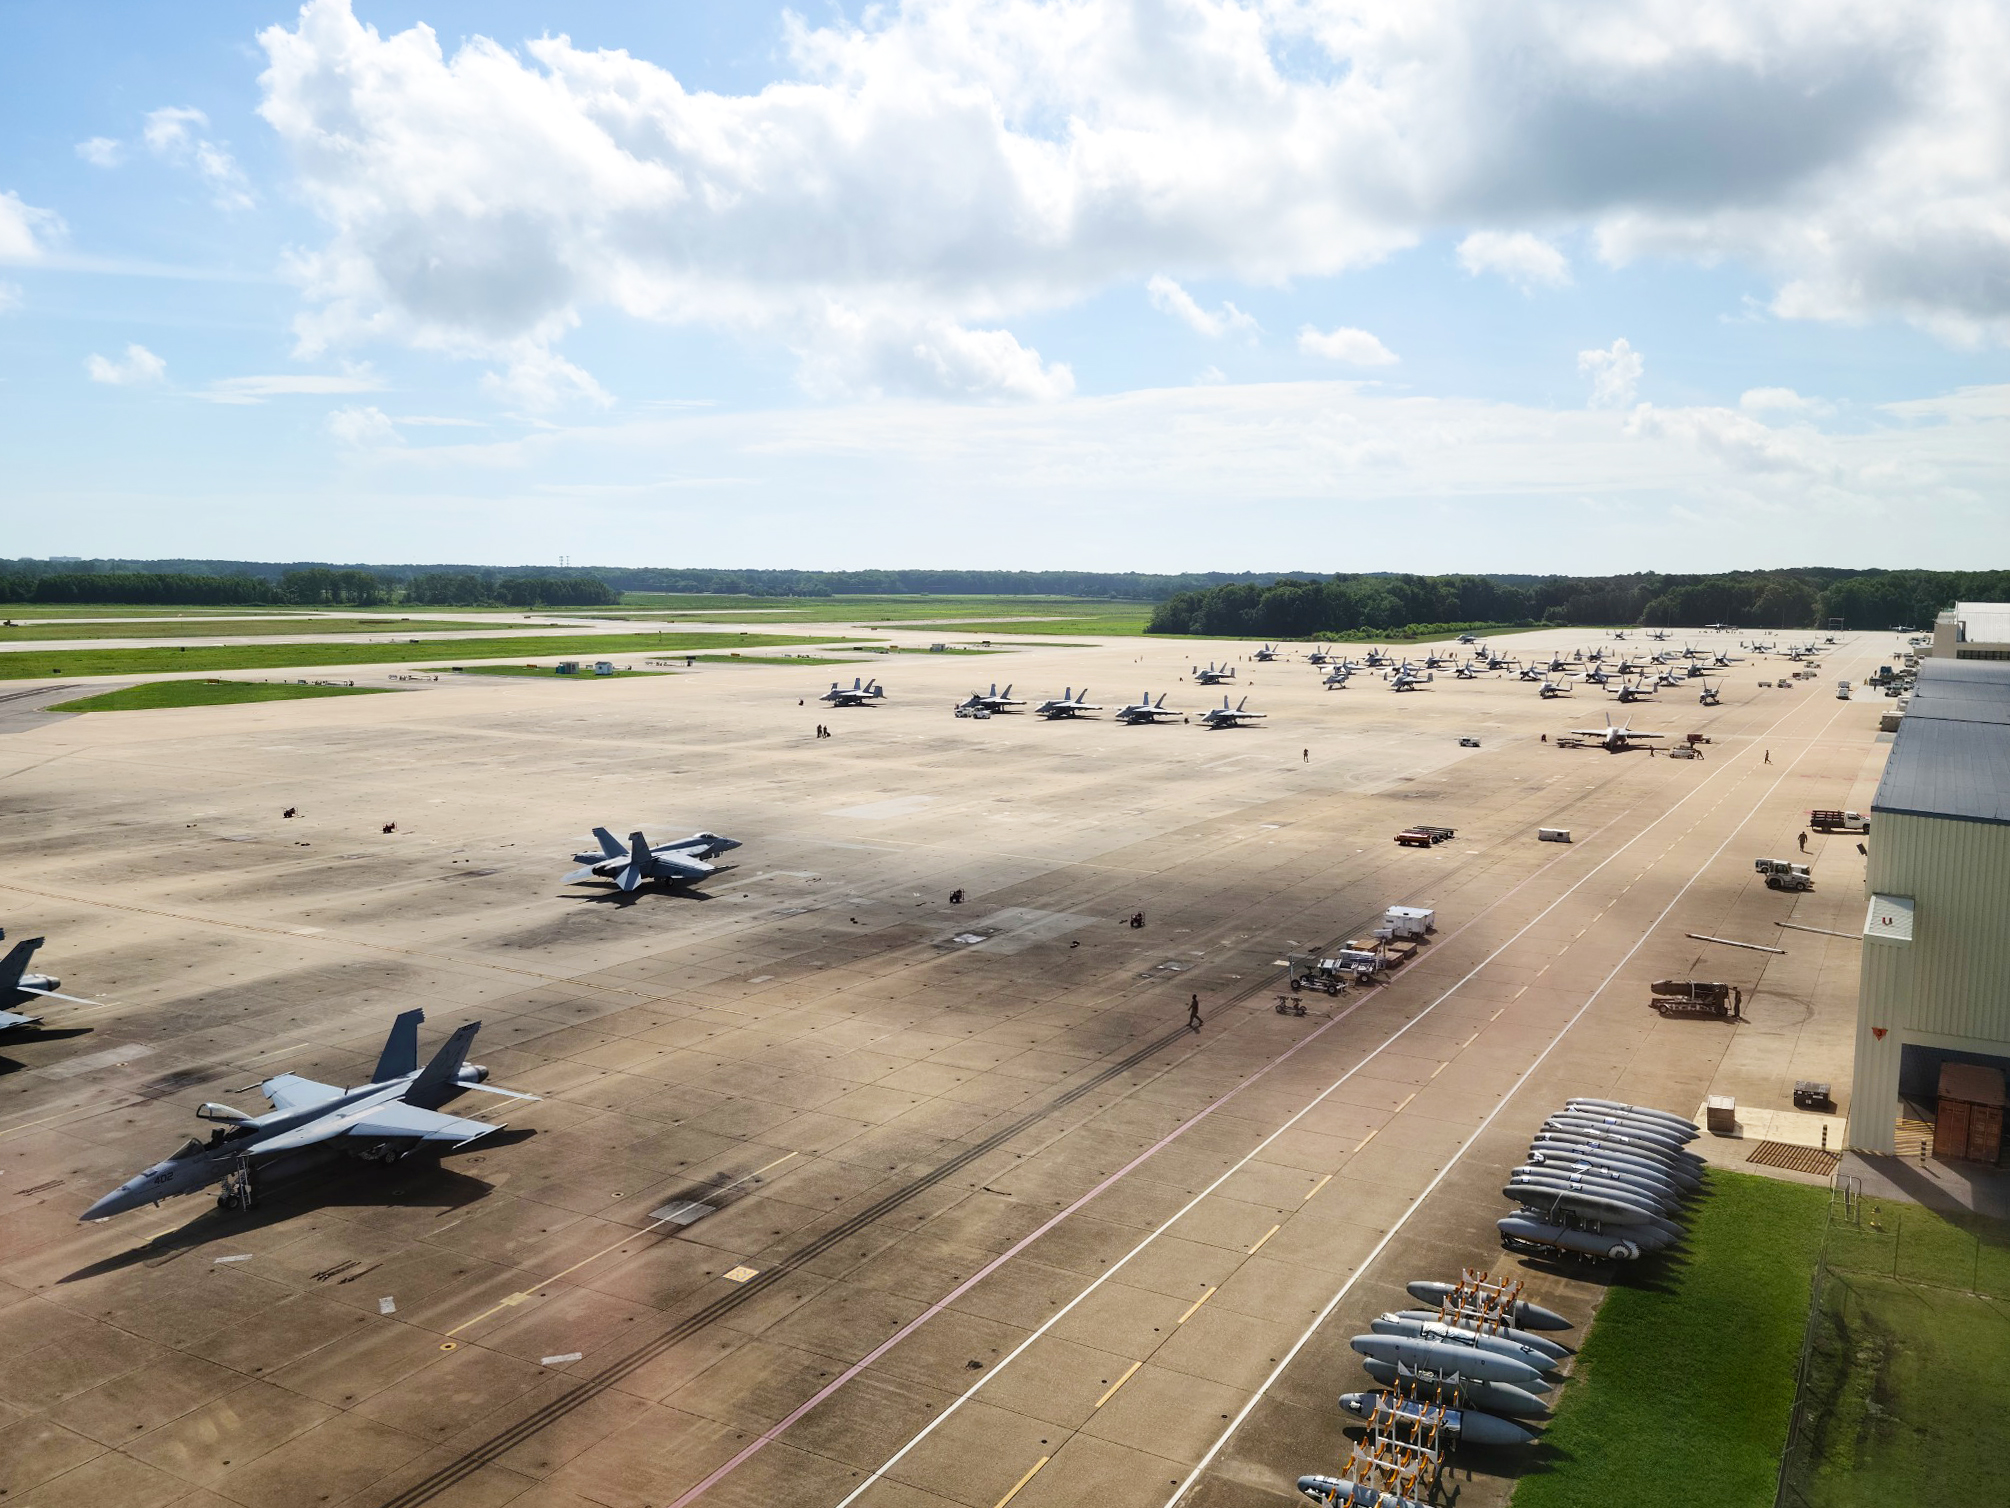
 NAS Oceana in August 2020.
Recommendations by the CRE® Consulting Corps
The Counselors of Real Estate’s Consulting Corps delivered strategic guidance and an action plan to Naval Air Station Oceana. The second in this 4-part series will analyze the Installation’s Morale Welfare and Recreational activities and facilities and Base housing and renovation needs, and present strategies for future development.
Read: Part 1 | Part 3 | Part 4
Watch: MWR Activity Analysis
Skip Preble, CRE, discusses MWR Activities on March 31, 2021.
Non-Core Function Data Analysis
The non-core functions at Naval Air Station (NAS) Oceana are most closely aligned with Morale Welfare and Recreational (MWR) activities. These functions are funded and operated differently; however, they all share one common characteristic: They all are financially supported by Base Operations Support (BOS) at some level. This analysis explores the non-core activities and their viability for the future.
Navy Gateway Inn & Suites
The Navy Gateway Inn & Suites (NGIS) is a 24 hour per day / 7 day per week lodging operation operating similarly to a civilian hotel. The clients are active and retired military members, as well as Department of Defense civilians who enjoy the extra security of being behind the fence line of the installation. Additional cost for security may be required if it were placed outside the fence line to ensure the safety of the guests. Additionally, this facility reportedly has the laundry operation for the entire Hampton Roads NGIS operations. Therefore, at the request of the client, it was excluded from this analysis.
The List of Non-Core Functions
The list of non-core functions for NAS Oceana was compiled from a workbook provided by the client with 2019 data for each of the 17 MWR activities. The individual worksheets were summarized in the table in Figure 2 and data added regarding their individual Uniform Funding Management (UFM) category, whether or not they were considered to be a required function, and whether or not they were a childcare function. Each of these added items helped us to understand their source of funding and whether their funding was likely to be cut in the future.
Childcare is a required non-core function.
The table in Figure 1 summarizes the definitions used in determining into which category of funding each of the 17 MWR activities fell.
Figure 1: Uniform Funding Management (UFM) Definitions Used
| Category | Definition | Description |
| A | Mission Sustaining | These programs are considered essential in meeting organizational objectives of the Military Services. They promote the physical and mental well-being of the military members and will be supported almost entirely with UFM. |
| B | Community Support | These programs are closely related to those in Category A supporting the military mission but are generally focused on the physiological and psychological needs of Service members and their families. These support programs should receive substantial amounts of UFM support but differ from those in Category A in part because of their ability to generate NAF (Non-appropriated Funds) revenues. |
| C | Business Activities | These programs provide recreational activities and contribute to building a sense of community on the base. Activities in this group have a business capability of generating enough income to cover most of their operating expenses but lack the ability to sustain themselves based purely upon their business activity. Consequently, these activities receive limited appropriated fund (APF) support. |
Figure 2: Summary of MWR Activities — January 1, 2019 – December 31, 2019
| Original Order | MWR Activity – NAS Oceana | UFM Category | Required Function? | Function | Patron Count | Revenue | NAF Expenses | Net Revenue |
UFM Support | Net Revenue After Support |
| 1 | OC O’CLUB | C | No | Non-Childcare | 2,709 | $17,750 | $29,185 | $(11,435) | $0 | $(11,435) |
| 2 | OC CPO CLUB | C | No | Non-Childcare | 2,729 | $16,995 | $27,817 | $(10,822) | $0 | $(10,822) |
| 3 | OC COMMUNITY RECREATION | A | Yes | Non-Childcare | 153,063 | $579,884 | $917,869 | $(337,985) | $797,381 | $459,396 |
| 4 | OC VEHICLE STORAGE | C | No | Non-Childcare | 350 | $101,382 | $8,706 | $92,676 | $0 | $92,676 |
| 5 | OC AUTO HOBBY | B | No | Non-Childcare | 7,127 | $135,878 | $227,660 | $(91,782) | $279,998 | $188,216 |
| 6 | OC CAR WASH | C | No | Non-Childcare | 1,571 | $8,532 | $4,714.00 | $3,818 | $0 | $3,818 |
| 7 | OC THEATER | C | No | Non-Childcare | 17,457 | $95,608 | $56,097 | $39,511 | $0 | $39,511 |
| 8 | OC FITNESS & SPORTS | A | Yes | Non-Childcare | 269,777 | $105,185 | $721,253 | $(616,068) | $602,775 | $(13,293) |
| 9 | FEET WET POOL | B | No | Non-Childcare | 14,238 | $4,447.00 | $29,497.00 | $(25,050) | $29,304 | $4,254 |
| 10 | OC WATERPARK | B | No | Non-Childcare | 12,249 | $83,382.00 | $124,061.00 | $(40,679) | $116,762 | $76,083 |
| 11 | OC SKEET RANGE | C | No | Non-Childcare | 24,587 | $210,948.00 | $239,502.00 | $(28,554) | $0 | $(28,554) |
| 12 | OC BOWLING | C | No | Non-Childcare | 145,139 | $488,428.00 | $499,406.00 | $(10,978) | $0 | $(10,978) |
| 13 | OC GOLF | C | No | Non-Childcare | 81,893 | $1,297,238 | $1,252,146 | $45,092 | $0 | $45,092 |
| 14 | OC RV PARK | C | No | Non-Childcare | 61,845 | $620,989 | $291,878 | $329,111 | $0 | $329,111 |
| 15 | OC Child Dvlpmnt Ctr | B | Yes | Non-Childcare | 69,680 | $1,646,000 | $3,960,615 | $(2,314,615) | $2,314,616 | $1 |
| 16 | MIDWAY MANOR SAC (YOUTH CTR) | B | Yes | Non-Childcare | 23,400 | $296,663 | $836,477 | $(539,814) | $693,403 | $153,589 |
| 17 | OCEANA & MIDWAY YOUTH/TEENS/SPORTS/OH | B | Yes | Non-Childcare | 29,976 | $42,671 | $1,071,102 | $(1,028,431) | $45,312 | $(983,119) |
| Totals | 917,790 | $5,751,980 | $10,297,985 | $(4,546,005) | $4,879,551 | $333,546 | ||||
| Totals – Non-Childcare MWR | $794,734 | $3,766,646 | $4,429,791 | $(663,145) | $1,826,220 | $1,163,075 | ||||
| Totals – Childcare | 123,056 | $1,985,334 | $5,868,194 | $(3,882,860) | $3,053,331 | $(829,529) | ||||
The information referenced as to whether a particular service is required or not was provided by the client in an Excel spreadsheet of N9 Services.
Childcare was broken out as a separate category. We recognize that NAS Oceana facility is a 24 hours per day/ 7 days per week operation, and as a result, childcare for Naval personnel must be available on a similar basis. This type of childcare is not typically found in civilian counterparts, and therefore we felt that there was an even higher priority on being certain that this operation is funded even over other required functions.
Totals provide insight into possible constituency for each activity, relative self-sufficiency, sources of excess revenue and cash drains, possible future cash flow shortfalls (UFM funding cuts), unused or under-utilized facilities.
These categories provide insights into the likely size of the constituency for each activity, as well as their relative self-sufficiency. In addition, it allowed us to consider which activities might be sources of excess revenue or future cash drains.
The patron count provides a total of the individual uses of each MWR activity throughout the entire year. We considered this to be a good indicator of the number of active users and used it as an indicator of the likely strength of support for continuation of that activity on the base. Revenue reflects all income generated by that activity. NAF expenses refer to non-appropriated fund expenses; the difference between revenue and expenses is net revenue (or losses).
UFM Support refers to funding available from the Uniform Funding Management program based on how the activity is categorized. Some activities have all their shortfalls covered, some activities have only a portion of their shortfalls covered, and nearly half of the activities have no UFM support at all.
The Net Revenue After Support column reflects the relative year-end income position for each of the activities, with a total for all activities reflected at the and the totals for the group separated into non-childcare MWR activities and childcare-related MWR activities. Overall, the MWR activities were in the black, but the childcare-related MWR activities were nearly $830,000 in the red. While this analysis is accurate within the confines of the Navy’s financial system it is not an accurate comparison to private sector business practices that would include a proportionate share of BOS costs. Rather, the Navy’s financial system is an excellent tool for tracking money that was spent; however, it is a poor measure of how much things actually cost.
Fitness is a required non-core function.
MWR Activity Analysis by Required Function Status
The table in Figure 3 represents the MWR activities sorted by their status as a required function.
Figure 3: Summary of MWR Activities by Required Function
| Original Order | MWR Activity – NAS Oceana | Required Function? | Patron Count | Revenue | NAF Expenses | Net Revenue |
UFM Support | Net Revenue After Support |
| 1 | OC COMMUNITY RECREATION | Yes | 153,063 | $579,884 | $917,869 | $(337,985) | $797,381 | $459,396 |
| 2 | OC FITNESS & SPORTS | Yes | 269,777 | $105,185 | $721,253 | $(616,068) | $602,775 | $(13,293) |
| 3 | OC Child Dvlpmnt Ctr | Yes | 69,680 | $1,646,000 | $3,960,615 | $(2,314,615) | $2,314,616 | $1 |
| 4 | MIDWAY MANOR SAC (YOUTH CTR) | Yes | 23,400 | $296,663 | $836,477 | $(539,814) | $693,403 | $153,589 |
| 5 | OCEANA & MIDWAY YOUTH/TEENS/SPORTS/OH | Yes | 29,976 | $42,671 | $1,071,102 | $(1,028,431) | $45,312 | $(983,119) |
| 6 | OC O’CLUB | No | 2,709 | $17,750 | $29,185 | $(11,435) | $0 | $(11,435) |
| 7 | OC CPO CLUB | No | 2,729 | $16,995 | $27,817 | $(10,822) | $ | $(10,822) |
| 8 | OC VEHICLE STORAGE | No | 350 | $101,382 | $8,706 | $92,676 | $0 | $92,676 |
| 9 | OC AUTO HOBBY | No | 7,127 | $135,878 | $227,660 | $(91,782) | $279,998 | $188,216 |
| 10 | OC CAR WASH | No | 1,571 | $8,532 | $4,714 | $3,818 | $0 | $3,818 |
| 11 | OC THEATER | No | 17,457 | $95,608 | $56,097 | $39,511 | $0 | $39,511 |
| 12 | FEET WET POOL | No | 14,238 | $4,447 | $29,497 | $(25,050) | $29,304 | $4,254 |
| 13 | OC WATERPARK | No | 12,249 | $83,382 | $124,061 | $(40,679) | $116,762 | $76,083 |
| 14 | OC SKEET RANGE | No | 24,587 | $210,948 | $239,502 | $(28,554) | $0 | $(28,554) |
| 15 | OC BOWLING | No | 145,139 | $488,428 | $499,406 | $(10,978) | $0 | $(10,978) |
| 16 | OC GOLF | No | 81,893 | $1,297,238 | $1,252,146 | $45,092 | $0 | $45,092 |
| 17 | OC RV PARK | No | 61,845 | $620,989 | $291,878 | $329,111 | $0 | $329,111 |
| Totals | 917,790 | $5,751,980 | $10,297,985 | $(4,546,005) | $4,879,551 | $333,546 | ||
| Totals – Non-Required Functions | 371,894 | $3,081,577 | $2,790,669 | $290,908 | $426,064 | $716,972 | ||
| Totals – Required Functions | 545,896 | $2,670,403 | $7,507,316 | $(4,836,913) | $4,453,487 | $(383,426) | ||
Key takeaways:
- Only 5 of the 17 MWR activities are considered a required function.
- When considering the number of patrons, the 5 required functions are 59% of the patronage, while the other 12 MWR activities constitute 41% of the patronage.
- From a gross revenue perspective, the 5 required MWR activities generate 46% of the gross revenue and the 12 nonrequired generate 54%.
- The required MWR activities generate a full 73% of all reported expenses, and the nonrequired activities generate 27%.
- As a result, 91% of all UFM support goes to the required activities and only 9% is available to the nonrequired activities.
Watch: The Navy’s Financial System
Skip Preble, CRE, discusses NAS Oceana’s financial system.
The Navy’s financial system is an excellent tool for tracking money that was spent; however, it is a poor measure of how much things actually cost.
Analysis Relative to the Number of Patrons
As a further analysis of the data, we considered the number of patrons per activity excluding childcare. From this information we hope to discern which activities might be most difficult to change or outsource to the private sector based on the number of active users. We excluded childcare because we felt that considering changes to this portion of the MWR program would impose an undue burden on a significant portion of the base community.
The Navy’s financial system is an excellent tool for tracking money that was spent; however, it is a poor measure of how much things actually cost.
Figure 4: Number of Patrons — Excluding Childcare
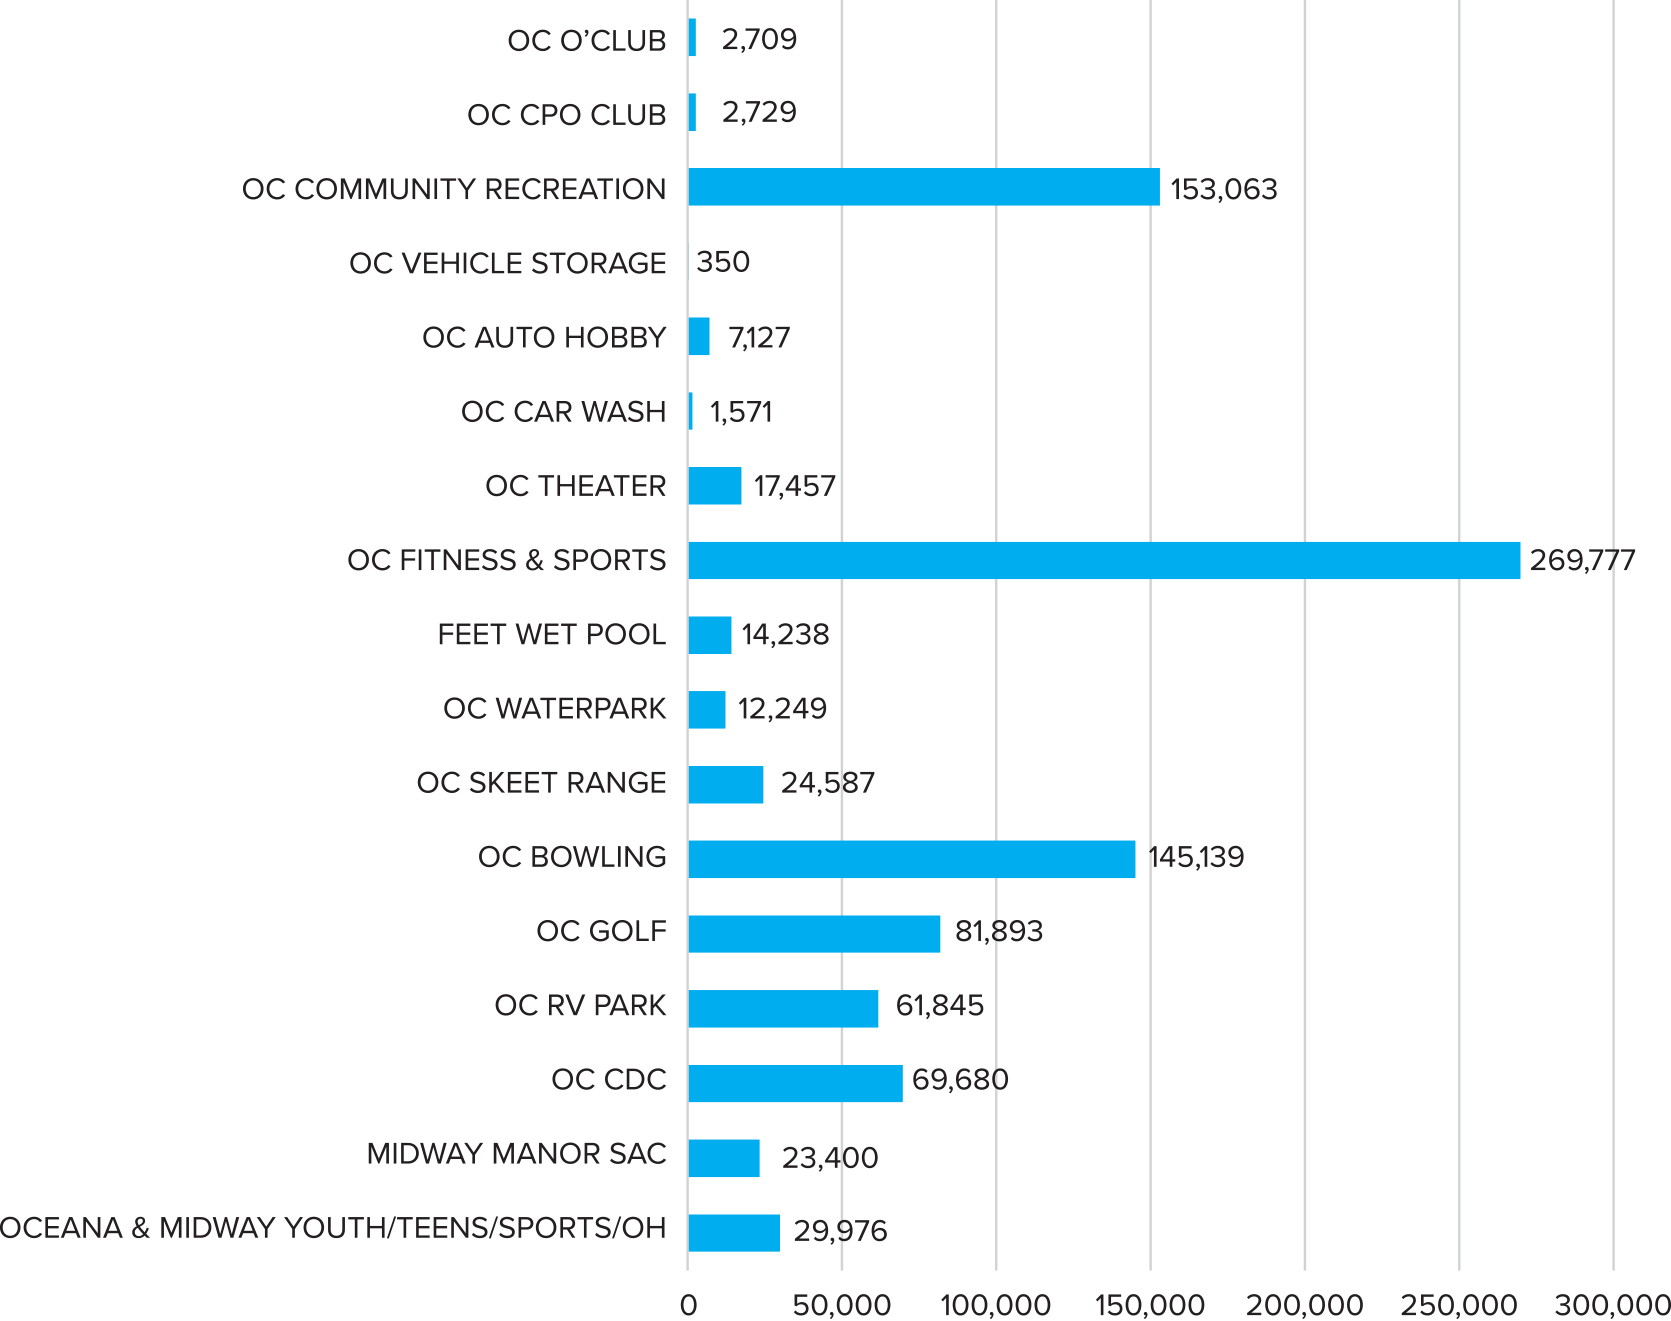
Of the roughly 795,000 total patrons for the 14 non-childcare MWR activities, 82% are involved in 4 activities and the other 13 MWR activities only account for 18% of the total patron count. As can be seen in the graphic above, the 4 most utilized MWR activities are fitness and sports, community recreation activities, bowling, and golf. If the RV Park patrons are added to these 4 activities, fully 90% of all the MWR patrons are involved with only 5 of the MWR activities.
MWR Activity by UFM Category
The table in Figure 5 is sorted by the UFM Categories A, B and C as discussed at the beginning of this section. Category A activities are essential to the proper operation of the base and receive full UFM financial support to cover any revenue shortfalls. Category B activities are also eligible for UFM support, but not to the full extent of Category A activities.
Figure 5: MWR Activity Sorted by UFM Category
| Original Order |
MWR Activity – NAS Oceana | UFM Category |
Patron Count |
Revenue | NAF Expenses |
Net Revenue |
UFM Support |
Net Revenue After Support |
| 3 | OC COMMUNITY RECREATION | A | 153,063 | $579,884 | $917,869 | $(337,985) | $797,381 | $459,396 |
| 8 | OC FITNESS & SPORTS | A | 269,777 | $105,185 | $721,253 | $(616,068) | $602,775 | $(13,293) |
| 15 | OC Child Dvlpmnt Ctr | B | 69,680 | $1,646,000 | $3,960,615 | $(2,314,615) | $2,314,616 | $1 |
| 16 | MIDWAY MANOR SAC (YOUTH CTR) | B | 23,400 | $296,663 | $836,477 | $(539,814) | $693,403 | $153,589 |
| 17 | OCEANA & MIDWAY YOUTH/TEENS/SPORTS/OH | B | 29,976 | $42,671 | $1,071,102 | $(1,028,431) | $45,312 | $(983,119) |
| 9 | FEET WET POOL | B | 14,238 | $4,447 | $29,497 | $(25,050) | $29,304 | $4,254 |
| 10 | OC WATERPARK | B | 12,249 | $83,382 | $124,061 | $(40,679) | $116,762 | $76,083 |
| 5 | OC AUTO HOBBY | B | 7,127 | $135,878 | $227,660 | $(91,782) | $279,998 | $188,216 |
| 1 | OC O’CLUB | C | 2,709 | $17,750 | $29,185 | $(11,435) | $0 | $(11,435) |
| 2 | OC CPO CLUB | C | 2,729 | $16,995 | $27,817 | $(10,822) | $0 | $(10,822) |
| 4 | OC VEHICLE STORAGE | C | 350 | $101,382 | $8,706 | $92,676 | $0 | $92,676 |
| 6 | OC CAR WASH | C | 1,571 | $8,532 | $4,714 | $3,818 | $0 | $3,818 |
| 7 | OC THEATER | C | 17,457 | $95,608 | $56,097 | $39,511 | $0 | $39,511 |
| 11 | OC SKEET RANGE | C | 24,587 | $210,948 | $239,502 | $(28,554) | $0 | $(28,554) |
| 12 | OC BOWLING | C | 145,139 | $488,428 | $499,406 | $(10,978) | $0 | $(10,978) |
| 13 | OC GOLF | C | 81,893 | $1,297,238 | $1,252,146 | $45,092 | $0 | $45,092 |
| 14 | OC RV PARK | C | 61,845 | $620,989 | $291,878 | $329,111 | $0 | $329,111 |
| Totals | 917,790 | $5,751,980 | $10,297,985 | $(4,546,005) | $4,879,551 | $333,546 | ||
| Totals – Category A | 422,840 | $685,069 | $1,639,122 | $(954,053) | $1,400,156 | $446,103 | ||
| Totals – Category B | 156,670 | $2,209,041 | $6,249,412 | $(4,040,371) | $3,479,395 | $(560,976) | ||
| Totals – Category C | 338,280 | $2,857,870 | $2,409,451 | $448,419 | $0 | $448,419 | ||
The Category A and B activities had a cumulative net revenue shortfall in 2019 of $4,994,124 before UFM Support. After receiving a reported $4,879,551 in UFM support, there was still a year-end shortfall of $114,873.
Category C activities are intended to be operated as businesses, with the goal of at least covering their own expenses from their revenues. The overall net revenue for Category C activities totals $448,419.
However, not all the activities are as financially successful as the others, with 4 of the activities having a cumulative loss of $61,789 and the other 5 MWR activities generating surplus funds totaling $510,208. Of that total surplus, Vehicle Storage contributed $92,676 in net revenues and the RV Park contributed $329,111.
Summary and Conclusions
- At the request of the client, the Navy Gateway Inn and Suites was not included in this analysis.
- There is a total of 17 non-core MWR functions at NAS Oceana.
- Of the 17 total functions, 3 relate directly to childcare for military families; due to their uniqueness and relatively high priority they were not considered part of this restructuring analysis.
- Childcare-related MWR activities ended in 2019 almost $830,000 in the red, even after UFM Support.
- Only 5 of the 17 MWR functions are what is referred to as required functions.
- The 5 required functions have 59% of the total annual patrons. They generated 46% of all gross revenues and 73% of all reported expenses.
- The 5 required MWR functions received 91% of all UFM Support.
- Out of the 14 non-childcare MWR functions, 82% of the 2019 patrons were involved in 4 of the functions, and the remaining 18% of patrons were spread over the other 13 activities.
- Category A and B MWR functions are the only MWR activities eligible for UFM Support. These activities had a year-end shortfall of $114,783, even after receiving almost $4.9 million in UFM Support.
- Category C activities generated an overall positive cash flow of $448,419. Of these activities, five generated $510,208 in positive cash flow, and the other four activities had cumulative net losses of $61,789. Furthermore, none the costs listed include any portion of BOS Costs allocated to each activity. If a cost baseline analysis of each activity were indexed to private sector equivalent businesses, municipal services like first responder, roads and grounds maintenance, utility system maintenance, etc., all of these costs would be borne by businesses proportionately.
Non-Core Facility Functional Assessment
In the previous section, the MWR functions themselves were addressed in terms of the number of patrons from the base population for each activity, as well as the revenue, expenses and the net cash flow after additional UFM funding, where available.
The table in Figure 6 presents an inventory of all the facilities used by the required base functions, including MWR functions. The base housing is part of this inventory but will be addressed separately. Since the MWR functions in the previous section were grouped and analyzed by UFM category, the corresponding facilities were grouped by UFM category, as well.
Figure 6: Required MWR Facilities by UFM Category
| Activity | Required Function? | UFM Category | BLDG | Building Area (SF) | Building Age (Years) | Building Replacement Value | $ PSF OF BUILDING | CONDITION RATING | FACILITY CONDITION INDEX | SHORE TASK |
| Galley | Yes | A | 520 | 42,826 | 66 | $26,948,022 | $629 | 63 | 84 | FOOD SERVICES |
| Fitness Center (Small) | Yes | A | 529 | 31,557 | 63 | $9,902,074 | $314 | 67 | 79 | MWR |
| Fitness Center (Big) | Yes | A | 545 | 40,630 | 19 | $12,167,526 | $299 | 90 | 83 | MWR |
| Softball Fields | Yes | A | 621 | MWR | ||||||
| Softball Fields | Yes | A | 623 | 56 | $1,382,709 | MWR | ||||
| Running Track | Yes | A | 624 | 4,230 | 11 | $227,076 | $54 | MWR | ||
| Softball Fields | Yes | A | 631 | 44 | $1,382,709 | MWR | ||||
| Tennis Courts | Yes | A | 632 | 61 | $988,284 | MWR | ||||
| Total – Category A | 119,243 | 46 | $52,998,400 | |||||||
| Total – Category A MWR Activities | 76,417 | $26,050,378 | ||||||||
| Child & Youth Programs | Yes | B | 526 | 17,725 | 5 | $3,879,852 | $219 | 96 | 87 | YOUTH CENTER |
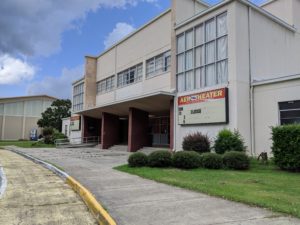
| Child & Youth Programs; Fleet & Family Service Center; Aero Theater | Yes | B | 531 | 108,709 | 64 | $25,150,723 | $231 | 71 | 71 | YOUTH CENTER |
| Child Development Center | Yes | B | 450 | YOUTH CENTER | ||||||
| Aeropines Water Park | No | B | 582 | 7,087 | 64 | $2,392,915 | $338 | 99 | MWR | |
| Auto Hobby Shop | No | B | 543 | 11,851 | 44 | $899,784 | $76 | 67 | 25 | MWR |
| MWR Equipment Rental | No | B | 299 | MWR | ||||||
| MWR Maintenance Facility | No | B | 527 | 6,938 | 61 | $660,958 | $95 | 65 | 21 | MWR |
| Recreational Pool | Yes | B | 481 | MWR | ||||||
| Total – Category B | 152,310 | 48 | $32,984,232 | |||||||
| Indoor Handball Court | No | C | 630 | 2,647 | 53 | $579,406 | $219 | 63 | 82 | YOUTH CENTER |
| Bowling Alley | No | C | 540 | 23,242 | 49 | $4,101,503 | $176 | 64 | 77 | MWR |
| Golf – Aeropines Golf Clubhouse | No | C | 581 | 12,667 | 31 | $2,281,717 | $180 | 75 | 84 | MWR |
| Golf – Driving Range | No | C | 583 | MWR | ||||||
| Golf Course (18H) – Hornet | No | C | MWR | |||||||
| Golf Course (18H) – Tomcat | No | C | MWR | |||||||
| Great Escape Enlisted Club | No | C | 430 | 27,879 | 65 | $6,292,636 | $226 | 60 | 71 | MWR |
| Officers’ Club | No | C | 480 | MWR | ||||||
| RV & Boat Storage Yard | No | C | MWR | |||||||
| Skeet Range | No | C | MWR | |||||||
| Total – Category C | 66,435 | 50 | $13,255,262 | |||||||
| Total – All Categories | 337,988 | $99,237,894 | $294 | |||||||
The inventory data was incomplete in some cases, but not enough to materially impact the analysis of the facilities and the resulting conclusions.
The expenses accounted for in the operational review of the MWR programs are all direct costs of operation, including cost of goods sold and labor. In a private sector environment, there would be a charge for rent which would compensate the owner of the structure housing the facilities for repair and replacement expenditures, as well as provide for return on investment and depreciation expense. After review of the total net cash flow available from operations for the MWR functions, it became clear that there is little excess cash available from operations to help pay for maintenance and repairs to the buildings housing those functions. As a result, many facilities show signs of deferred maintenance and likely reflect increased operating costs as compared to newer, better-maintained buildings.
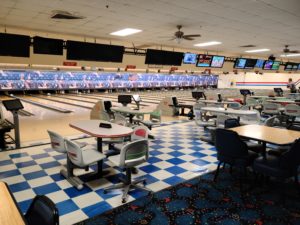
Bowling is a non-core function that does not break even without a BOS burden.
According to the Figure 6 summary table, the buildings and related improvements range from 5 to 68 years of age, with an overall average age of 47 years. We have assumed that several of the buildings have been remodeled and/or repaired, but even so there are only 3 facilities that are 20 years old or less. Of the remaining facilities, 8 are more than 50 years old.
Many facilities show signs of deferred maintenance and likely reflect increased operating costs as compared to newer, better-maintained buildings.
Special-purpose facilities such as the bowling alley and the indoor handball court depreciate more quickly than general-purpose buildings. Typically, they are more expensive both to build and to maintain, and they also tend to suffer from functional obsolescence due to their specific design and the likelihood of changes in user preference or market behavior over time.
Generally, structures older than 40 years of age are considered fully depreciated both from a functional and physical perspective. As a result, their continued use will result in significantly higher operations and maintenance costs as well as decreased efficiencies. Depending upon the uniqueness of the building and its overall condition, the only way to address these age-related issues at this point are either a full renovation or replacement.
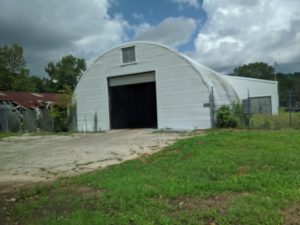
Grounds Maintenance Shed
The Facility Condition Index reflects a recent inspection of the buildings, with a score of 100 indicating good condition and a lower score indicating problems with the building’s overall condition and functional utility. Of the buildings in this group, two had scores that indicated significant issues with their condition.
These were the MWR Equipment Rental facility (which had a score of 21) and the Auto Hobby garage (which had an overall score of 25), indicating that both will need to be fully remodeled or replaced in the near future if they are to continue operations.

Foliage growing inside the Officers Club
Non-Core Functional Assessment Conclusions
- Operating expenses do not reflect the full cost of occupancy.
- Therefore, maintenance and upkeep tend to be deferred.
- Building upgrades are typically not done due to lack of funding availability.
- Base structures are generally near the end of their effective life of 40 to 50 years.
- Structures which are still in relatively good condition can have their effective lives extended by repair and remodeling.
- Older buildings with significant deferred maintenance will likely need to be replaced.
- Special-purpose buildings typically have shorter useful lives than do general-purpose buildings. Any decision to remodel or replace such buildings should consider the option of using alternative providers for that MWR function.
- The MWR Equipment Rental Facility and the Auto Hobby garage are apparently in relatively poor condition and may need repairs soon.
Without renovation and sustained capital infusion to keep a structure operable, time, trends and technology eventually render them obsolete
In many ways, our observations illustrate the dichotomy between the required funding for BOS compared to the actual funding of this requirement. As buildings age, they require more maintenance, repairs and upgrades to ensure their continued operations. Without renovation and sustained capital infusion to keep a structure operable, time, trends and technology eventually render them obsolete.
It seems a common trend within the armed services is to design buildings to theoretically last forever. However, even the most innovative design (i.e. The Pentagon) is not immune to the ravages of time, trends and technology. Within 10 years (or less), a new building’s mechanical components begin to wear and require replacement. Private-sector property owners and their lenders reserve funds for continued maintenance and upgrades from the day the structure is completed. Still, no structure can avoid functional obsolescence because market preferences change, and it is rare to see a thirty-year-old structure that has not been renovated, demolished, or repurposed. Recognizing obsolescence is unavoidable, those advancing Future Base Design (FBD) may wish to investigate the military’s approach to designing structures to last 60 years when they may only be able to perform their mission for 30 years. Acknowledging obsolescence may reduce construction costs of some structures in the future.
Base Housing Assessment
Our team was provided data for 10 housing facilities. One report referred to Building 446 as base housing, but it was not listed in the facilities database and we could not find it on the base website. Therefore, we have assumed that it is not in use at this time.
Figure 7: Existing Base Housing Inventory
| Activity | BLDG | BUILDING AREA (SF) |
BUILDING AGE (YEARS) |
BUILDING REPLACEMENT VALUE |
$ PSF OF BUILDING | CONDITION RATING | FACILITY CONDITION INDEX |
SHORE TASK |
| Unaccompanied Housing | 530 | 63,268 | 62 | $23,500,107 | $371 | 46 | -8 | UNACCOMPANIED HOUSING – PERMANENT PARTY |
| Unaccompanied Housing | 431 | 97,890 | 53 | $36,360,016 | $371 | 35 | 35 | UNACCOMPANIED HOUSING – PERMANENT PARTY |
| Unaccompanied Housing | 419 | 87,449 | 38 | $33,657,167 | $385 | 38 | 68 | UNACCOMPANIED HOUSING – STUDENT DORM |
| Unaccompanied Housing | 444 | 32,688 | 21 | $12,141,549 | $371 | 78 | 88 | UNACCOMPANIED HOUSING – PERMANENT PARTY |
| Unaccompanied Housing | 441 | 32,667 | 21 | $12,133,749 | $371 | 86 | 89 | UNACCOMPANIED HOUSING – PERMANENT PARTY |
| Unaccompanied Housing | 442 | 33,227 | 21 | $12,341,754 | $371 | 87 | 89 | UNACCOMPANIED HOUSING – PERMANENT PARTY |
| Unaccompanied Housing | 536 | 123,199 | 37 | $45,760,728 | $371 | 79 | 90 | UNACCOMPANIED HOUSING – PERMANENT PARTY |
| Unaccompanied Housing | 443 | 33,654 | 21 | $12,500,357 | $371 | 82 | 91 | UNACCOMPANIED HOUSING – PERMANENT PARTY |
| Unaccompanied Housing | 445 | 31,930 | 21 | $11,859,999 | $371 | 82 | 91 | UNACCOMPANIED HOUSING – PERMANENT PARTY |
| Unaccompanied Housing | 423 | 61,801 | 49 | $22,955,209 | $371 | 83 | 96 | UNACCOMPANIED HOUSING – PERMANENT PARTY |
| TOTALS | 597,773 | 34.4 | $223,210,635 | $373 |
There are approximately 1,800 barracks containing nearly 600,000 SF of Unaccompanied Housing provided on the base, distributed over 10 buildings. Of the 10 buildings, 5 are 21 years old. The other 5 buildings range between 37 years of age and 62 years of age, with an average overall age of 34 years. However, the 5 buildings built 21 years ago are all approximately 32,000 SF in size and therefore represent just over 164,000 SF or 27% of the 600,000 SF of housing present on the base. This means that most of the remaining buildings, or 73% of the base housing, is 40 years old or more.
Replacement/Renovation Needs
Of the 5 older buildings, 3 have low Condition and/or Facility Condition Ratings. This would mean that they are likely candidates for full remodeling or replacement. These are Buildings 419, 431 and 530. They range in age from 38 to 62 years old, contain a total of 248,607 SF of building area and have a combined estimated building replacement value of $93,517,290.
Watch: Market Review and Development Opportunities
Kirk King, CRE, compares onsite housing to the Virginia Beach and Hampton Roads markets.
We were informed during our base tour that the Navy has current plans to renovate several of the barracks buildings. The estimated cost to perform this work are as follows:
- 132 rooms at a cost of $33 million, or $250,000 per room
- 168 rooms at a cost of $46 million, or $273,000 per room
Since these structures are on Base, there is no separate line item for land cost. We did not have the plans for these buildings, so we were not able to estimate the cost per square foot as proposed. However, a cost of $250,000-$273,000 per room, for only vertical construction costs, is quite high compared to private sector metrics. Even if there are legitimate reasons for this expense, we felt it prudent to compare these budgets to some recently built apartments from the area.
To accomplish this, we obtained comparable construction cost from members of The Counselors of Real Estate. In response to the request for information, we received 9 to 10 immediate replies; one referred us to Peter S. Eckert, CRE®, of Eckert and Company Inc. Mr. Eckert is a specialist in multifamily feasibility analysis and valuations, and not only lives in Virginia but used to live in Virginia Beach. In response to our request, he provided the data summarized in the table in Figure 8. The examples are from the area near Virginia Beach and represent three-story walk-up buildings and do not include any amenity or land costs, so they are roughly equivalent to the proposed base housing estimates.
Figure 8: Three Story Walk-Up Replacement Cost Comparisons
| Project | Year Built |
Units | GBA | GBA/ Unit |
Acres | Site* | Bldg | Soft Costs |
Financing | Profit | Total |
| Comp 1 | 2014 | 208 | 279,291 | 1,343 | 15.790 | $4,207,466 | $15,176,570 | $4,617,111 | $2,420,518 | $2,642,167 | $29,063,832 |
| Comp 2 | 2018 | 282 | 305,950 | 1,085 | 16.120 | $3,750,000 | $24,875,000 | $2,268,700 | $3,086,349 | $2,884,514 | $36,864,563 |
| Comp 3 | 2020 | 120 | 169,284 | 1,411 | 5.999 | $2,256,910 | $12,656,940 | $2,083,119 | $1,598,382 | $1,853,725 | $20,449,076 |
| Comp 4 | 2020 | 204 | 276,132 | 1,354 | 16.508 | $5,649,000 | $24,063,000 | $3,233,631 | $2,719,287 | $3,566,492 | $39,231,410 |
| Comp 5 | 2015 | 134 | 205,487 | 1,533 | 2.475 | $1,539,036 | $12,229,902 | $1,549,789 | $1,868,758 | $1,718,748 | $18,906,233 |
| Comp 6 | 2019 | 120 | 148,518 | 1,238 | 8.313 | $2,126,215 | $10,308,400 | $1,077,792 | $1,193,451 | $1,470,586 | $16,176,444 |
| Comp 7 | 2020 | 200 | 261,898 | 1,309 | 13.240 | $4,853,500 | $25,910,500 | $4,133,583 | $2,614,441 | $3,751,202 | $41,263,226 |
| $ Per Unit | |||||||||||
| Comp 1 | $20,228.20 | $72,964.28 | $22,197.65 | $11,637.11 | $12,702.73 | $139,729.96 | |||||
| Comp 2 | $13,297.87 | $ 88,209.22 | $8,045.04 | $10,944.50 | $10,228.77 | $130,725.40 | |||||
| Comp 3 | $18,807.58 | $105,474.50 | $17,359.33 | $13,319.85 | $15,447.71 | $170,408.97 | |||||
| Comp 4 | $27,691.18 | $117,955.88 | $15,851.13 | $13,329.84 | $17,482.80 | $192,310.83 | |||||
| Comp 5 | $11,485.34 | $91,267.93 | $11,565.59 | $13,945.96 | $12,826.48 | $141,091.29 | |||||
| Comp 6 | $17,718.46 | $85,903.33 | $8,981.60 | $9,945.43 | $12,254.88 | $134,803.70 | |||||
| Comp 7 | $24,267.50 | $129,552.50 | $20,667.92 | $13,072.21 | $18,756.01 | $206,316.13 | |||||
| Comparable Averages | |||||||||||
| Project | Year Built |
Units | GBA | GBA/ Unit |
Acres | Site* | Bldg | Soft Costs |
Financing | Profit | Total |
| 7 | 2018 | 181 | 235,223 | 1,325 | 11.2 | $19,070.88 | $98,761.09 | $4,952.61 | $12,313.55 | $14,242.77 | $159,340.90 |
| As a % of Total | 12.0% | 62.0% | 9.4% | 7.7% | 8.9% | 100.0% | |||||
| $ Per SF of GBA | |||||||||||
| Comp 1 | $15.06 | $54.34 | $16.53 | $8.67 | $9.46 | $104.06 | |||||
| Comp 2 | $12.26 | $81.30 | $7.42 | $10.09 | $9.43 | $120.49 | |||||
| Comp 3 | $13.33 | $74.77 | $12.31 | $9.44 | $10.95 | $120.80 | |||||
| Comp 4 | $20.46 | $87.14 | $11.71 | $9.85 | $12.92 | $142.07 | |||||
| Comp 5 | $7.49 | $59.52 | $7.54 | $9.09 | $8.36 | $92.01 | |||||
| Comp 6 | $14.32 | $69.41 | $7.26 | $8.04 | $9.90 | $108.92 | |||||
| Comp 7 | $18.53 | $98.93 | $15.78 | $9.98 | $14.32 | $157.55 | |||||
| Comparable Averages | |||||||||||
| Project | Year Built |
Units | GBA | GBA/ Unit |
Acres | Site* | Bldg | Soft Costs |
Financing | Profit | Total |
| 7 | 2018 | 181 | 235,223 | 1,325 | 11.2 | $14.49 | $75.06 | $11.22 | $9.31 | $10.76 | $120.84 |
| As a % of Total | 12.0% | 62.1% | 9.3% | 7.7% | 8.9% | 100.0% | |||||
| *Site Development Costs Excluding Land Value or Acquisition Cost | |||||||||||
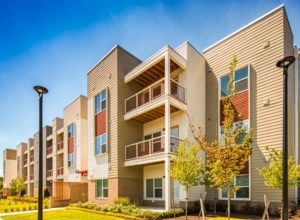
Multi-family housing in the Virginia Beach area.

Unit interior – Kitchen
A total of 7 comparable projects recently built in the Virginia Beach area were included in this evaluation. We did not have the plans and specifications for the proposed barracks, so it was difficult to compare them to these construction projects. However, these projects are targeted to a middle- and upper-income clientele and are in neighborhoods that demand modern designs and finishes. Even so, their final cost per unit is roughly one-half that of the Navy’s cost only to renovate two barracks, and the average gross building area for the apartments shown previously is approximately four times the size of the average barracks. This fact led us to conclude that the savings which could be realized by private construction of unaccompanied housing (barracks) was significant enough to justify researching alternate strategies.
Their [private housing] final cost per unit is roughly one-half that of the Navy’s cost.

Average unit size over 1,000 SF

Construction costs include lounges, pools and fitness centers.
Base Housing Conclusions
After visiting the Base and reviewing the information provided, we concluded that a significant percentage of the base facilities need to be upgraded or replaced. In addition, funding must be made available to provide an ongoing maintenance program so that the useful lives of the existing facilities can be extended.
The budget issues described previously are inextricably linked to the building conditions being addressed in this facilities section of the report. None of the MWR activities have any expenses reflecting repairs or depreciation expenses for the facilities being used during their operations. As a result, even the MWR activities reflecting positive cash flow have overstated their ability to be self-funding.
In addition, similar operations in the private sector charge property taxes against their operations as a normal and reasonable expense. None of the base activities incur a similar expense, and therefore none of what we refer to as the “normal cost of civilization” are being accounted for in these operations. Granted, many of these activities have limited abilities to generate revenue; however, if the true costs of operation are reported, reflecting repair and depreciation expenses, as well as the shared cost of base operations, they can at least be accounted for and plans made to address the issues.

Unaccompanied housing requires significant repair and renovation.
Considering the current cost of new construction and facilities maintenance, it makes sense to consolidate base functions in as few buildings as possible to minimize repair issues and free up room in the annual budget for preventive maintenance and remodeling. This would be an added benefit to reviewing current MWR activities and moving as many as possible to the private sector.
It makes sense to consolidate base functions in as few buildings as possible.
Regarding base housing, we see 2 primary issues. First, the newest of the base housing is 21 years old at this point, and over 70% of the remaining base housing is at least 40 years old. Of the buildings 40 years old or more, 3 are in poor enough condition that they will soon need significant remodeling or replacement. The second issue is that even with the older existing base housing renovated and operational, there is significant need for additional base housing so that as much of the base population who want or need to live on base can do so. However, cost of new construction for the Navy is nearly double the cost for the private sector so implementing a process to utilize the private sector for construction and operation of Navy base housing would be more cost-effective.
Goals and Recommendations
Our recommendations are intended to accomplish the following 4 goals:
- Remove redundant MWR services from the Base budget.
- Provide more and better Base housing.
- Minimize maintenance expenses for Base facilities.
- Where possible, repurpose Base land and facilities to generate income and/or reduce cost.
We recommend the following actions:
Review MWR Functions:
- Establish clear, objective criteria for reviewing the net cost (reflecting direct and indirect facilities costs) and effectiveness of MWR functions.
- Consider the likelihood of reductions in UFM expense sharing.
- Review all MWR functions using these criteria.
- Determine which MWR functions can and should be outsourced.
Consider available options for MWR functions:
- Should this function be maintained or eliminated?
- If it should be maintained, consider the available private sector options.
- How close should the activities for the function be to the base?
- Consider drivetime versus distance.
- The optimum proximity should vary by activity. For instance, people will drive further to go play golf than they will to wash their car.
- Are the private sector service providers open to the idea of a “Navy Special” for their pricing?
- If so, is the cost to the service member and their family competitive with the cost of the MWR function it is replacing? This should consider both out-of-pocket cost and relative value
- The buying power of the Base should provide significant value to any (business savvy) private vendor, and this should result in a significant discount for the Base community.
- Ideally, the relationship should be nonexclusive, allowing the competitive vendors to provide for the service members’ business.
- How close should the activities for the function be to the base?
- If there are no acceptable private vendor alternatives, the choice is to:
- eliminate the function entirely, or
- keep the function but
- make changes to the business model which increase the net revenue before subsidy or
- make changes that minimize the hidden cost of facilities.
- If the MWR function is moved to the private sector and the facility is closed, the facility which previously housed the function must be either repurposed or eliminated entirely. If the building is sitting empty, it is continuing to accrue expenses in terms of deferred maintenance, security, and opportunity cost.
Base Housing Options:
- Both housing goals involve construction of new housing or extensive renovation of existing housing. Therefore, the first task is to answer the question: Who will be responsible for building and maintaining the housing?
- We determined in the previous section that new housing built by the private sector tends to be substantially less expensive than housing built by the Navy.
- There are known issues involved in private sector construction of new Base housing. These issues need to be addressed in such a way that the solution is agreeable to the Navy and still attractive to the private sector.
- If these issues can be resolved, the same budget can build twice as many housing units via the private sector. With the right structure, more funding might be available to address this Base housing need through some sort of Public Private Partnership.
MWR Alternatives Analysis
When NAS Oceana was commissioned in the 1940s, the surrounding community was agriculturally oriented, with very few services or recreational activities available for service members to use. As a result, on-base recreation and services were necessary. Things have changed in the decades since, and the area around the base has grown in population and recreational resources. In addition, the on-base services have not been able to keep up with the newer, more modern options in the surrounding community. Therefore, we believe it is in the long-term best interest of the Navy (service members and retirees) to outsource as many of the MWR functions as possible to the private sector.
As an example of our proposed strategies for reducing MWR activity expenses, we selected 4 of the more popular activities and then researched the availability of competitive services provided by the private sector.
Figure 9: Sample MWR Activities & Alternatives
| MWR Activity | MWR Cost | Alternative | Alternative Cost | Delta | Recommendation |
| Bowling Alley | $3.50 | Pinboys at the Beach | $6.95 | $(3.45) | These bowling alleys are more expensive than the MWR facilities, but both were advertising 30% or more discounts for groups so a service member discount should be easy to negotiate. |
| AMF Lynnhaven | $6.00 | $(2.50) | |||
| Car Wash | $6.00 | Autobell Carwash | $6.00 | $- | These private facilities are near to the base and offer excellent wash services. |
| Grand Slam Carwash | $6.00 | $- | |||
| Movie Theater | $ – | AMC Lynnhaven 18 | $10.50 | $(10.50) | The Base theater is closed so we couldn’t get current charges. All 3 private theaters offered lower matinee prices, and a service member discount should be available as well. |
| Regal Strawbridge Marketplace | $10.50 | $(10.50) | |||
| Regal Columbus | $10.50 | $(10.50) | |||
| Golf | $30.00 | Bow Creek Municipal Golf Course | $20.00 | $10.00 | There were more courses available than we could include here, but these were most comparable to Aeropines Course. Considering current conditions in the golf course market, a service members discount should be achievable. |
| Red Wing Lake Golf Course | $25.00 | $(5.00) | |||
| Kempsville Greens Golf Course | $21.00 | $9.00 |
We wanted to be certain that the service providers were easily accessible to all members of the base community. Therefore, the proximity of the service providers to the base was an important consideration. The bowling alleys and carwashes are located within a 5-mile radius of the base, and the movie theaters and public golf courses are located within a 10-mile radius of the base.
All of these provide services at least equal to those provided on base, and in some cases just as conveniently. Considering the significant un-accounted for expenses involved in providing each of these functions and the fact that there are very attractive options available to the base community, we recommend that as many of the MWR functions as possible be outsourced to the local business community.
We believe it is in the long-term best interest of the Navy (service members and retirees) to outsource as many of the MWR functions as possible to the private sector.
MWR Outsourcing Strategies
Should the Navy elect to outsource MWR activities, we recommend it secure agreements with local and national providers collectively. For example, in exchange for closing the golf course and directing all the patrons to play elsewhere, the Navy should obtain a fixed rate agreement from all the golf courses within a 20-mile radius to discount their rates by 20% for Range, Greens and Cart fees for all active duty, reserve or retired service members. The other courses are likely to welcome the opportunity in exchange for assurances the Navy will close its courses at NAS Oceana. The quality of life for service members is enhanced as they will have more options to play on more courses at prices at or below the price paid at NAS Oceana. The community benefits through the reduction in competition and increased patronage, making regional golf courses healthier. The Navy benefits by no longer needing to maintain the golf course and allowing the property to be developed with compatible uses.
Movie theaters are non-core facilities being displaced by the internet.
The same strategy can be applied with every MWR activity by offering patronage buying power to obtain discounted rates in exchange for assurances the Navy will no longer provide those services. Some agreements like Waterparks, Golf and Bowling could be negotiated with local providers, while others like movie tickets may entail a national strategy with national chains. To avoid a missed opportunity, we recommend the Navy use its purchasing power leverage to secure equal or greater benefits for its service members rather than simply eliminating a MWR activity.
Golf is a non-core activity in an area saturated with competition.
Strategies for Future Development
EUL Parcels
NAS Oceana has a number of vacant or underutilized land parcels that potentially have value to monetize. The benefits are new/ additional funds to help pay for infrastructure, facilities and base activities. There is untapped potential for infill locations in a market with growing commercial demand and demand for developable land.
Following this path, base leadership, working with NAVFAC MIDLANT, identified a number of parcels (See maps in Figures 10 and 11). The implementation of commercial leasing and development on these parcels is not a simple task. It is well known that forested acreage in Virginia Beach is generally deemed to be wetlands (otherwise, previous generations of farmers would have cut them down and planted the ground). In fact, there are numerous challenges to executing an Enhanced Use Lease (EUL) program:
- Wetland issues
- Access (fence line), with related security issues
- Legal risk (AICUZ – Air Installations Compatible Use Zones, APZ -Accident Potential Zones, zoning, etc.)
- No current master plan, land use vision or development strategy
- Distance from the Port and close Interstate access
- Aging infrastructure
- Market perception of the difficulty of dealing with the Navy
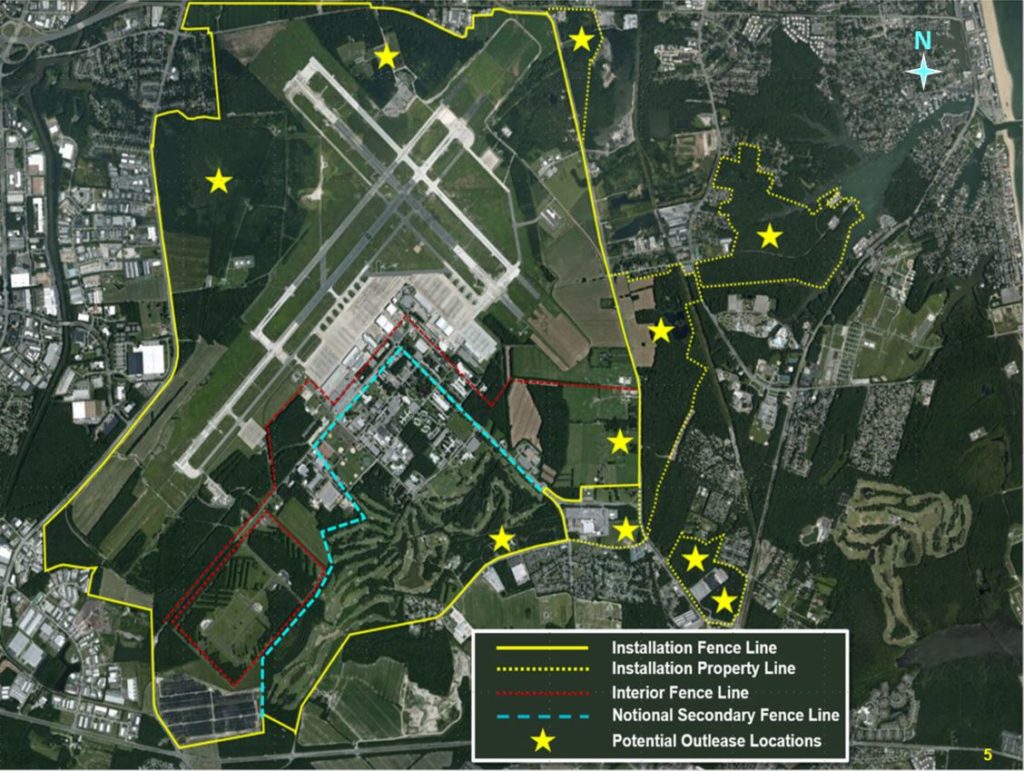
Figure 10: Many portions of the installation could be EUL candidates.
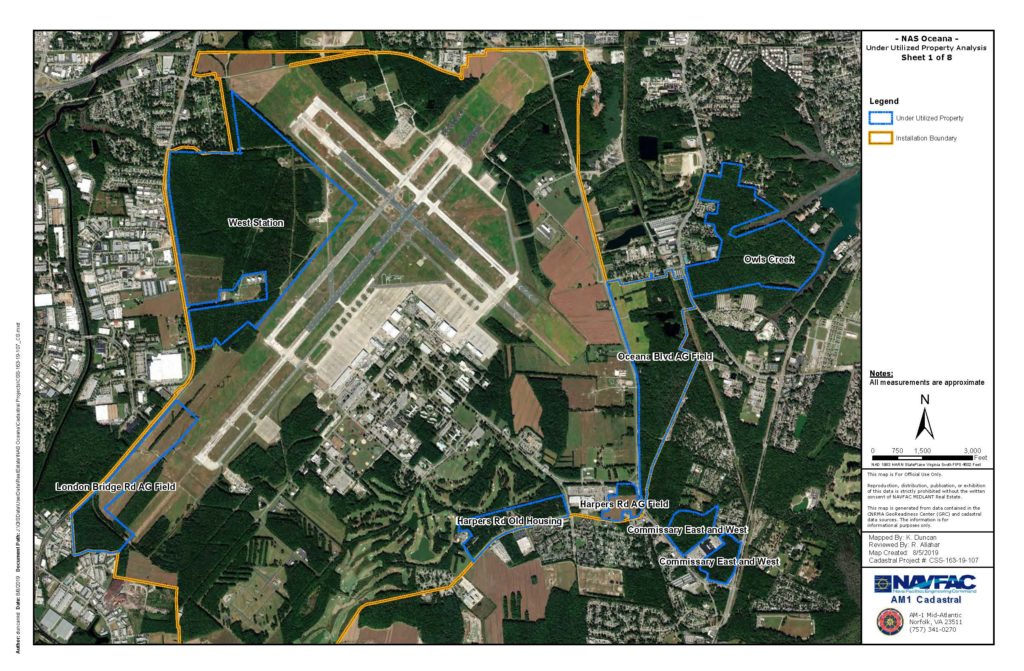
Figure 11: Stars indicate parcels for which EULs have been offered to the public via RFI
Given these constraints, with one or two exceptions such as Dominion Energy, these parcels are not readily marketable until/unless they have been fully vetted in terms of their development potential. “Due diligence” is complex, time-consuming and expensive. Individual developers are unlikely to undertake the expense and risk on their own and for individual parcels with no development planning in place. Furthermore, the Navy does not have the funds to undertake a detailed development planning process to unlock the development potential for these parcels.
For the undeveloped parcels, the market value of the land is worth less than it would be if analysis and planning were completed for development purposes. Once it is vetted through thorough due diligence and value enhancement processes (environmental, legal, zoning, infrastructures, costs to build/develop), the value increases. When pre-development occurs, creating “pad-ready” sites (with roads, utilities, stormwater drainage, visibility, etc.), the value of the land increases significantly.
The most important consideration is risk, as some of these sites may have little or marginal developable acreage. So, while there are more than 1,400 acres identified as potentially developable, in fact, the “net” acreage may be only 300 – 400 acres. Following the traditional or standard site analysis process, each parcel would be vetted for a certain number of square feet of buildings. Depending on the building type, a market rent for the entire structure can be determined, and within that rent is a return on the market value of the land itself.
For the dozen or so parcels totaling 1,400± acres, the due diligence, land use vision and master planning process may cost in excess of $1.0 Million. However, planning is the first step to unlock the monetary values of these parcels. If the Navy is not able to undertake this effort and expense, a development partner who can is critical.
Planning is the first step to unlock the monetary values of these parcels.
What’s In It For NAS Oceana?
Ultimately, these parcels deemed excess to the central mission of NAS Oceana can be “monetized” in some fashion to offset declining funding. At this point, we foresee annual rent “value” (value as it may not be market rent, but an in-kind equivalent) of $1.00 – $2.00/SF of developed space. For instance, a 50,000 SF building built by the EDA or similar intermediary could yield $50,000 – $100,000 of annual “value” to the Navy at Oceana. The actual amounts will vary depending on the difficulty of permitting and building on each site, as well as what ultimately gets built (see below highest and best use summary).
The Consulting Corps team’s initial estimates, presented at our briefing on August 7, 2020, suggest a market rent of $1 – $2/SF per building square foot, with perhaps 3.4 million SF of potential development. Thus, potential ground lease value of $3.4M to $6.9M in 15 to 20 years. While more developable sites may command rents above, and more challenging sites below, that range, it is reasonable to assume this would be the anticipated rental range before market inflation.
A possible scenario suggests the City’s EDA assume the role of Master Lessee.
However, in order to achieve this monetization of the vacant and underutilized parcels, a Master Plan is needed which addresses all environmental, legal, wetlands, zoning, etc. issues and is vetted by all the stakeholders including, but not limited to, NAS Oceana, NAVFAC MIDLANT, CNIC, City of Virginia Beach, Hampton Roads, Commonwealth of Virginia and others, such as neighbors, civic groups, etc.
If the Navy prefers to pursue an Enhanced Use Lease, the Consulting Corps team recommends it take the role of a “silent/limited partner.” In that role, the Navy continues to own the sites but would lease them initially short-term (not to exceed 5 years) to an entity that would complete the planning and permitting and ultimately enter into long-term EUL(s) once the potential value is identified and agreed to. Thus, the development risk is passed to the Master Tenant/Developer who has the expertise and resources to develop the sites for compatible uses.
The Consulting Corps team recommends the lease(s) have escalation clauses that could increase the payments periodically to reflect inflation over time. A possible scenario suggests the City’s EDA assume the role of Master Lessee; then, the EDA would oversee and provide the master planning and essential services equivalent to market value. Furthermore, it could align tax-exempt project and infrastructure financing with in-kind payments such as “moving the fence,” installation support services such as paving, water and sewer pipe maintenance, recreation maintenance and management, etc. Lastly, the EDA could ultimately execute a City-Base transaction if that is deemed to be in the best interest of all parties.
Inventory of Excess and Underutilized Parcels at Oceana
In June 2019, NAS Oceana and NAVFAC MIDLANT hosted “P-4 Industry Day” outlining the future base design concept and identifying specific parcels for potential out-leasing. Subsequently, other parcels have been added as “potentials” yielding 13±. At this point, these are all subject to thorough due diligence.1 Some portions of each site will be deemed undevelopable, without sufficient buildable areas, while others are much more desirable.
The Former Stables Parcel
This 140± acre site, of the dozen potential EUL parcels identified, may be the best parcel for development as it is flat, mostly dry, and has visibility and access from Oceana Boulevard. Its main development constraint is its location within the AICUZ and APZ. These restrictions limit the height, structure type, and occupancy (density of workers). In our initial analysis, we believe up to 1,000,000 SF (100± buildable acres at 10,000 SF of building per acre) is available at this site. This would need to be special purpose, low occupancy development. However, it should command the highest rent.
During our onsite base visit in early August, we learned that Dominion Energy had expressed interest in this site for a large-scale electric and battery storage site. There is some urgency with this prospect as an application must be filed with PJM (the regional ISO – Interstate Electric Grid Manager) in March 2021.
Dominion Energy described the need for 100 acres (net) to house shipping container-sized structures which house the rechargeable lithium ion batteries. Like a solar field, the units are networked together in series. While a 100± acre site might accommodate up to a 1,600 Mega Watt (MW) system, current thinking is for a 1,000 – 1,200 MW facility, allowing for future growth or reconfiguration as technology changes.
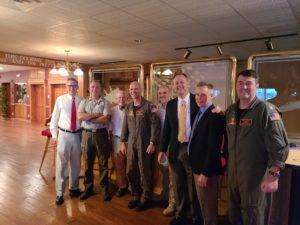
NAS Oceana leadership and Consulting Corps team confer after Exit Briefing.
A significant source of electricity will be the offshore wind project (2.6 Giga Watts) and various solar sites in the region. The offshore wind energy will come ashore at Dam Neck Annex and be fed to a sub-station to be located west of Dam Neck Annex but east of Oceana Boulevard. Both these projects fall under the Virginia Clean Economy Act which is current law. PJM (the ISO) is suggesting the first phase could be up and running by 2025. In order for this site to be fully considered, Dominion Energy must have 3 things: exclusivity (control); sufficient term (40 years minimum); and conveyance (an EUL or similar binding legal construct for them to control the development and use of this site for at least 40 years and longer with options to renew).
The CRE® Consulting Corps Team strongly feels this is a prime opportunity to kick off the Future Base Design Program with an “immediate” user. However, given that the former Stables Site is a prime developable parcel, Dominion Energy and PJM need to pay fair market rent (preferably with in-kind services vs. cash) which we believe is in the $2.0M to $2.5M per year range.2 Thus, a strong option or preferably an EUL initially for 5 years (granted by the Base Commander), but guaranteed to be extended for not less than 40 years, should be negotiated immediately (no later than December 30, 2020) in order to meet the proposal deadline.
The CRE® Consulting Corps Team strongly feels this is a prime opportunity to kick off the Future Base Design Program with an “immediate” user…Dominion Energy.
City-Base/Efficient Facilities Initiative Type Transaction
A more aggressive solution, both in complexity and results, would be a transaction similar to the Brooks City-Base transaction completed between the Air Force and the Brooks Development Authority (a non-profit development entity established by the City of San Antonio) in 2002. Brooks Air Force Base was originally on the 1995 Base Realignment and Closure (BRAC) list but then removed. The local Air Force leadership and the community began an ambitious planning process to reduce base operating costs for the installation resulting in the transfer of title to the base real estate to the Brooks Development Authority (BDA) and the subsequent lease back of most of the facilities by the Air Force. When the City-Base transaction was agreed to in principle, both parties acknowledged this milestone through the signing of a Non-Binding Agreement (NBA). The NBA documented the goals of the project and established a general outline of the transaction and the expected path and timeline to completion.
Watch: Brooks Development Authority
Kirk King, CRE, discusses the development of Brooks-City Base.
The NBA is probably the best summary for understanding the Brooks City-Base transaction at a high level.
Through a contract with a private property management firm, the BDA maintained the facilities for the Air Force as is typical for office or warehouse buildings in the private sector. The Air Force estimated the building and grounds maintenance services costs, provided by the BDA, to be $36M of their $52M in annual base operating costs. However, instead of charging the Air Force $36M, the BDA was able to provide these same services for $18M per year, a 50% savings to the Air Force. While these numbers are somewhat subjective, they illustrate of the magnitude of the savings achieved.
Figure 12: AF Base Operating Costs Before & After City-Base Conveyance
| AF Base Operating Costs (before City-Base conveyance) | Dollars | AF Base Operating Costs (after City-Base conveyance) | Dollars |
| Building & Grounds maintenance completed by BDA & reimbursed by AF through the lease | $36M | Building & Grounds maintenance completed by BDA & reimbursed by AF through the lease | $18M |
| Other Base Operating Costs | $16M | Other Base Operating Costs | $16M |
| Total AF Costs after City-Base Conveyance | $52M | Total AF Costs after City-Base Conveyance | $34M |
The cost savings to the Air Force actually began in February 2002 which was before the property conveyance in July 2002. This savings was established through a Cooperative Agreement between the Air Force and the BDA. However, it was not until after the conveyance of the real estate in July that the BDA was able to leverage the buildings and land the Air Force no longer had a current, or future, use for to generate revenue. Then, the BDA could use that revenue for new infrastructure and amenities to the Base, benefitting the Air Force and the neighboring community.
The BDA was able to lease buildings… in exchange for in-kind services like street repair and cleaning.
The BDA was a redevelopment authority under the Texas Local Government Code, which means it was a local government entity as a political subdivision of the State. This had advantages in the negotiations and the subsequent relationship as the BDA was not viewed suspiciously as a “private company” trying to profit off the Air Force. This helped in obtaining financial support from the City and favorable status from other public entities including utility companies. The BDA was able to lease buildings not needed by the Air Force to City departments in exchange for in-kind services like street repair and cleaning. The BDA also leased a small office space to the County Sheriff’s department to be a satellite office for in-kind services including regular sheriff’s deputy patrols through the base, increasing the law enforcement presence as a crime deterrent. The BDA, created and supported by the City, was able to establish a Tax Increment Reinvestment Zone in which the City and County pledged new property tax revenue from the Brooks City-Base project as a revenue stream to sell bonds with the City’s credit rating, used to fund infrastructure on and to the Base.3 This infrastructure was critical for facilitating development of the vacant land on Brooks. The Air Force organizations at Brooks believed the quality of facility maintenance was superior to what they had received prior to the transaction. Additionally, the Air Force elected to spend retained BOS funds at Brooks for facility upgrades and obtained the improvements at half the cost and quicker than MILCON.
The City and County pledged new property tax revenue from the Brooks City-Base project as a revenue stream to sell bonds with the City’s credit rating, used to fund infrastructure on and to the Base.
As a redevelopment authority supported by the City, the BDA looked at Brooks holistically as a part of the community and engaged consultants to develop a master plan with the Air Force to establish desired complementary land uses for different portions of the property. This allowed infrastructure planning and a strategy for new roads, utility construction, and ultimately leasing. The master plan was critical for Tax Increment Reinvestment Zone approval. Buildings were not leased for uses that were incompatible with the master plan. This master plan provided a system and framework for making joint decisions for continued development and improvement of Brooks City-Base. The master plan also provided a level of confidence to prospective tenants because they could see the plan for the future and understand how they fit into it. It was a living document adjusted as circumstances, needs and visions changed but always provided a guide and method for future goals and decisions.
Considerations for a master plan at Oceana might include the following:
- Consider adopting a declaration of covenants, conditions and restrictions (CC&Rs) to regulate and guide future development with the master plan as the central illustration for the vision of the future4
- Include AICUZ, noise and stand-off distance for sensitive Navy missions in the master plan and restrictions
- Include design guidelines in the CC&Rs for future buildings, landscaping and signs
- CC&Rs can be used to protect the interests of the Navy through regulation and an approval process of future development and prohibiting incompatible uses
- Allow for flexibility (options and a modification process) and future modification as the vision changes
- Establish public spaces (parks, etc.) with landscape guidelines with focus on visible and strategic areas
The Brooks City-Base transaction was groundbreaking, required creative thinking, open dialogue, and patient perseverance. The idea was formulated in 1997, soon after the 1995 BRAC, but the transaction did not occur until 2002. The transaction required Congressional approval (US 106-246) and support from all levels of the Air Force and Department of Defense, as well the City of San Antonio and State of Texas. Since this type of transaction has been completed before, it can serve as a guide for the Navy, making another City-Base type transaction easier and quicker than it was for the Air Force and the City of San Antonio. Documentation from the Brooks City-Base project provides guidance, should the Navy elect to pursue a City-Base type transaction. We recommend the Navy review the following documents:
- Non-Binding Agreement between the BDA and Air Force
- Cooperative Agreement between BDA and Air Force
- Joint Strategic Plan – foundational document for establishing the goals and outlining the project plans
- Comprehensive Economic Development Plan for South Central San Antonio with an emphasis on the Brooks City-Base Project – foundational document for the City understanding of how to incorporate Brooks City-Base into the community and as a focus for economic development
- Efficient Facilities Legislation (Public Law 106-246)
- Texas legislation for local government for defense base development authorities
- Air Force Environmental Impact Statement for Brooks City-Base
Conclusions
The Navy has several creative options that can be used to generate revenue at NAS Oceana or leveraged to improve the maintenance and condition of the infrastructure and facilities at Oceana. These options are not mutually exclusive; EULs can be executed while a more comprehensive City-Base type transaction is being explored and negotiated. Finally, developing a master plan is strongly recommended as a tool to jointly establish and communicate the Navy’s future plans for NAS Oceana. •
The Consulting Corps is The Counselors’ public service initiative. Members of The Counselors volunteer their time and expertise to help nonprofit and government entities by providing objective analysis, adaptive reuse strategies, and realistic action plans to leverage and maximize performance of real estate assets. For more information or to suggest a project that could benefit from Consulting Corps assistance, contact Samantha DeKoven. To learn more, visit cre.org/initiatives/consulting-corps.
Endnotes
1. The additional interior fence line depicted here is entirely notional and is only intended to illustrate the concept of increased public access to portions of NAS Oceana. The areas marked by yellow stars are those portions of NAS Oceana presently identified as underutilized federal property, which may be made available for commercial or other development meeting U.S. Navy airfield compatibility criteria, and installation security requirements. ↩
2. In the commercial development market, assuming 10,000 buildable SF/acre x 100 buildable acres = 1M SF of buildings with ground rent of a $2.50/SF/yr which equates to $25,000/acre/yr. Applying a 10% capitalization rate generates a market value of $250,000 per buildable acre, which ties back to several of the conversations we had with regional commercial brokers and developers. Given the relative ease of development for the specific site,
the market value may be $2.50/SF/year or $25,000 per acre. ↩
3. Tax increment financing (TIF) is a public financing method that is used as a subsidy for redevelopment, infrastructure, and other community-improvement projects. ↩
4. A Declaration of Covenants, Conditions, and Restrictions, commonly known as the CC&Rs, is a legal document made a part of the official real estate records that run with the land that is part of the community. ↩