
Volume 34, Number 3
Winter 2009-2010
By Hugh F. Kelly, CRE

Photo: Norman Chan/Shutterstock.com
A convenient definition of a bubble might be “a flimsy and temporary spherical structure, with nothing on the inside.” How bubbles have occurred throughout history has been the subject of quite a few instructive and frequently entertaining narratives.1 It is an amusing story line, until it strikes close to home. Then we can almost hear a collective groan of Homeric proportion, “Doh!” (O.K., so that’s Homer Simpson, but there are suddenly legions of financiers now feeling like that iconic schlub of an Everyman.)
How could we have gotten so out of control? In particular, how could even a flawed product like some (not all, by any stretch) of the subprime residential mortgage loans have transmogrified into a debilitating epidemic affecting the entire credit market and the world economy?
I am reminded of a study of the United States real estate banking industry I did in 1986,2 when the boom of the 1980s was ending and the savings and loan sector was imploding. I interviewed the senior vice-president/credit risk management of one of the nation’s largest banks whose desk was piled high with file folders of loans in default. “How did it happen?” I asked him. “It seemed like a good idea at the time,” he answered.
The sad fact is that we have experienced so many “financial crises” in the past two decades that we must suspect a more fundamental cause than simply “event risk” or “product failure.”
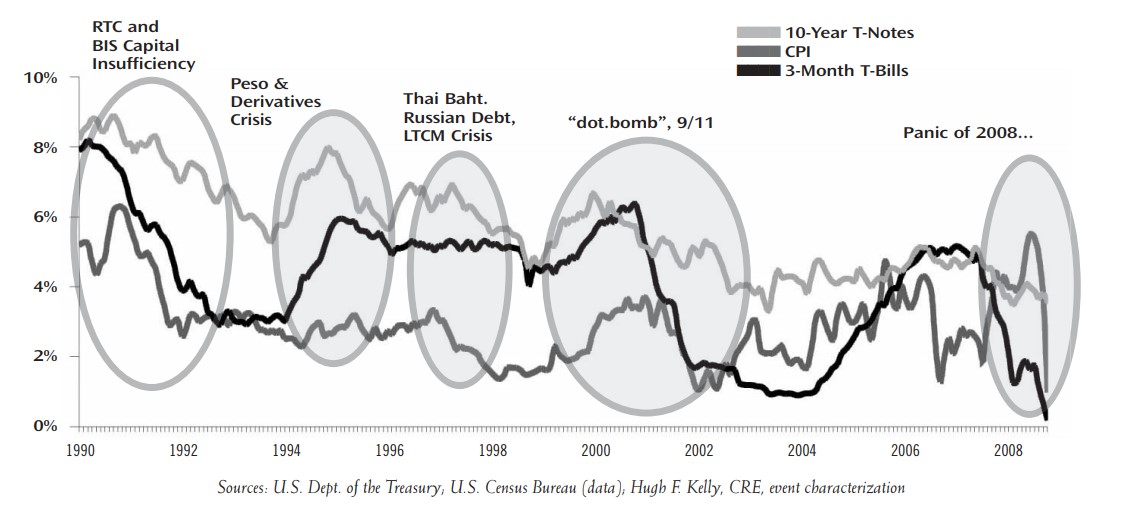
As illustrated in Figure 1, we have had the Resolution Trust Corporation (RTC) crisis, then a related capital crisis in the early 1990s when banks systemically had inadequate capital sufficiency by Bank of International Settlements standards. This was followed by a series of “derivatives crises” associated with the collapse of the Mexican peso in 1995, and then the Thai baht in 1997, leading to the fall of Long Term Capital Management.3 The economy was weakened again by the dot-com collapse in 2000, with the consequent shakeout in the telecom industry in the early years of the just-ended decade. Some have argued that we are in the midst of a high-risk, low-probability event,4 but the frequency of recurrence betrays some systemic weakness rather than a “fat tail” to the probability distribution.
Figure 1: Recurrent Crises Betrayed Systemic Fragility
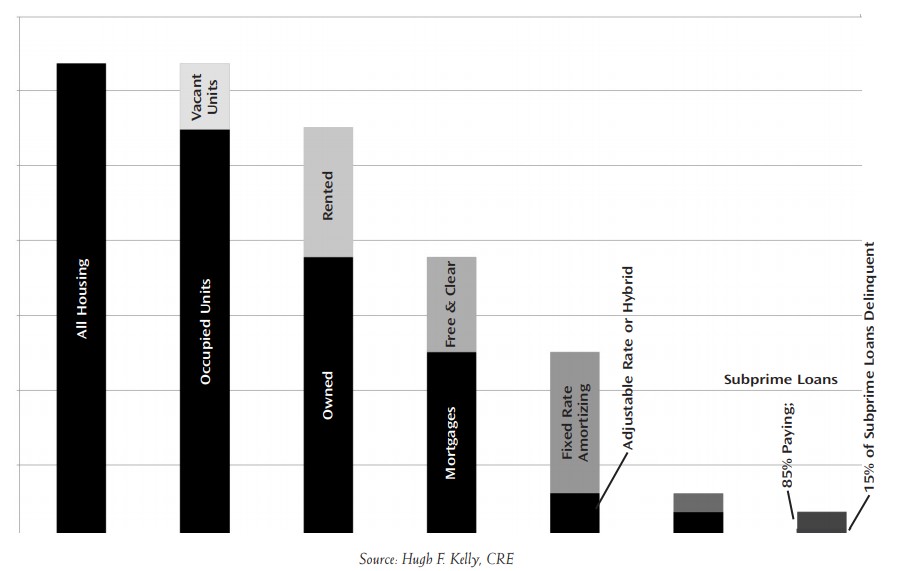
Confession, they say, is good for the soul, and I must admit that I was one of those who considered the subprime mortgage defaults originally as a product failure rather than an industry failure.5 After all, in August 2007, subprime defaults were a vanishingly small percentage of the U.S. residential market (see Figure 2). The total amount of subprime mortgage loans outstanding was $1.5 trillion, even after several years of explosive growth, and delinquencies among subprime loans was 15 percent—indicating trouble with approximately $195 billion of this risky debt. Losses appeared to be “containable” within the context of the $10 trillion residential mortgage system. My turn to say, “Doh!”6
Figure 2: Subprime Defaults in Context
Metastasis
By now, the basic story of the contagion that transmitted the risk of a rather limited amount of ill-advised U.S. housing debt through the financial markets to the point where the entire global economy was gripped with panic is fairly well known.
Like higher-quality forms of residential debt, subprime mortgages were packaged into Residential MortgageBacked Securities (RMBS). To a great extent, RMBS of this type were issued as so-called “private label” securities, since subprime mortgages were “non-conforming” loans under Fannie Mae and Freddie Mac standards, and thus not eligible for guarantees from the Government Sponsored Enterprises (GSEs). As early as March 2006, the Bank of International Settlement had noted that the securitization of non-prime housing loans represented an important shift in risk, since non-agency securities carried risks of both prepayment and default risk.7 Investors in Agency (GSE) securities were guaranteed against default risk. Nevertheless, from 2000–2005 the proportion of non-agency RMBS issuance rose from a 25 percent market share to approximately 56 percent. Private label RMBS, in other words, was squeezing out Agency securities, as non-agency issuance broke above $1 trillion. Moreover, the credit quality of the private label securities was dropping. The high-risk subprime component grew 20 percent per year after 2003. Subprime pools constituted 80 percent of non-agency RMBS issuance by 2006.8 In keeping with an increasingly integrated global capital market, offshore holdings of U.S. mortgage debt increased fourfold in the fifteen years beginning 1990, and were above $1 trillion at the middle of the past decade.9
What were the attractions of the non-agency debt for investors? Yield and volume.
The two factors are, unquestionably, related. The amount of money seeking investment grew monumentally over the course of the early 21st century, a phenomenon that has been called a Niagara of Capital. Anthony Downs of the Urban Land Institute and the Brookings Institution identifies a large number of sources of increased capital over that period: the economic expansion of nations such as China, India and other Asian nations; surplus savings accruing because of worldwide demographic patterns, evidenced in the emergence of sovereign wealth funds; the startling rise in U.S. corporate profits that soared from 7.1 percent of GDP in 2001 to 13.4 percent in 2006; the arbitrage of the low Japanese lending rate of 1.5 percent into risk-free U.S. Treasuries at 4.5 percent; and the rising profits of oil-producing countries, denominated in dollars. U.S. investments of all kinds, including real estate, were the largest potential target market.10
The law of supply and demand accurately predicts what occurs when huge levels of new demand impact a market. Asset prices rise in the short run, and the rise in price ultimately gives rise to an increase in the supply of product. So it was in housing finance. Rising asset prices are reflected in reduced yields. Yet investors of all stripes—pension funds, insurance companies, private equity funds, hedge funds, sovereign wealth funds, banks, mutual funds—clamored for enhanced returns. The securitization market, through the bundling of subprime mortgages, was able to offer such yields since the underlying subprime mortgages typically featured an interest rate structure that on a yield-to-maturity basis was 300 basis points higher than a prime mortgage loan.11 Regrettably, that higher yield was not appreciated for what it was: a significantly higher risk premium reflecting the loan’s greater ex ante default exposure. Subprime loans were extended to borrowers not qualifying for conventional mortgages, because of poorer credit histories, lack of income verification, or excessive leverage in the form of low or no down payments of equity in the home purchase.
Securitization helped disguise that level of risk in at least two ways. The pooling of the mortgages afforded the illusion of diversification. Diversification is the foundation of modern portfolio investment theory and is based on the sound premise that the combination of diverse assets can reduce the level of risk to a level less than the weighted average of the risk in the individual assets. Most investors understand the rudiments of diversification, but not many attend to the limits of its application. That limit is that portfolio construction, rigorously executed, can virtually eliminate idiosyncratic risk, that is, the risk that is particular to each individual asset. But what remains is systematic risk, that is, the risk that is common to all assets in the marketplace. For subprime loans, systematic risk is very high. And as is now apparent, that systematic risk was severely mispriced by the purchasers of RMBS with substantial weights in subprime mortgages.
The second important element masking risk was the flawed performance of the major rating agencies in evaluating expected losses in the waterfall of payment tranches in RMBS. Analyses from IMF economists and others offer details about why the rating agencies’ assumptions were implausibly optimistic, details that were known by market participants long before the crisis emerged. In some ways, it is just common sense to question how high-risk mortgages can, when bundled as a security, achieve a capital structure where 80 percent of the mortgage bonds are rated AAA, and 95 percent are rated A, AA, or AAA. As a relatively new product, the subprime RMBS looked back on a period of low defaults and rising home values. Based on that thin recent history, the rating agencies modeled the assumption of a roughly six percent default rate. Investors could have resisted that assumption and the resulting underestimation of default incidence and severity of loss. But the investors, especially those with fiduciary requirements demanding an “investment grade” rating as a condition for committing capital, had a significant incentive—in the form of incentive compensation and management fees—to simply accept a favorable rating for an investment that would boost their overall yield (at least in the short run).12
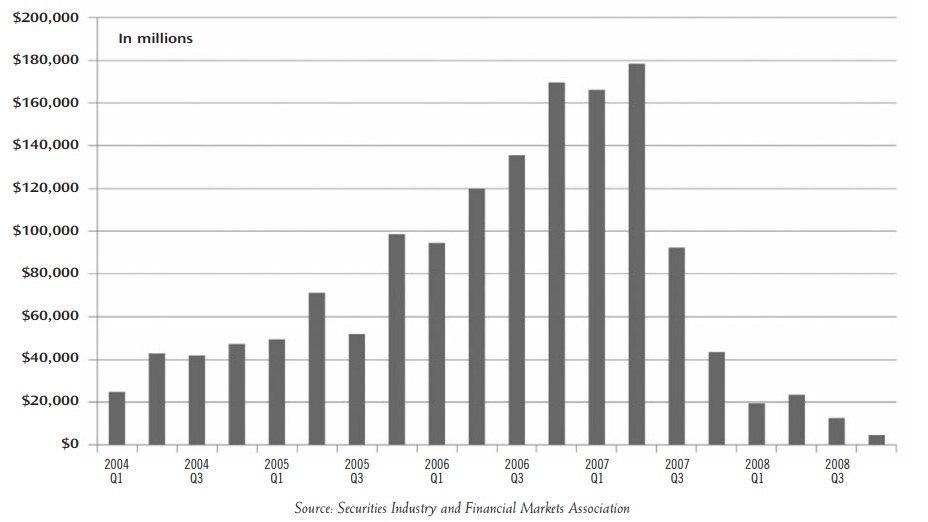
At the end of 2007, an estimated $600 billion in subprime mortgage bonds were outstanding, spreading risk widely across the world geography of investors. But amazingly, this was just the start of the path of contagion. Subprime loans then were repackaged in collateralized debt obligations (CDOs), described in financial engineering jargon as asset-backed synthetic securities.13 Issuance of CDOs more than tripled from 2004 ($157 billion) to 2006 ($521 billion), before being caught in the shutdown of the credit markets that the CDOs themselves helped to cause (see Figure 3).
Figure 3: Global CDO Issuance
CDOs are commonly issued by an investment bank (all of which have now been re-structured as commercial bank holding companies in order to be eligible to participate in the Federal Reserve’s “quantitative easing programs”). The standard game plan was to create a special purpose entity (SPE) to acquire assets like mortgage loans, auto loans, credit card receivables or corporate loans. Most often, the SPE would be legally formed outside the U.S., to avoid U.S. federal income tax. The SPE’s activity was limited to “investing” rather than trading or dealing in U.S. securities. The SPE would then issue bonds, with a sequential structure of priority for cash flows and credit losses, similar to RMBS. Like the mortgage bonds themselves, the CDOs would be rated by tranche. And, like the mortgage bonds, the CDO was an instrument for redistributing credit risk from the originator to other investors. Investment banks earned substantial fees while retaining (they thought) little residual liability. At the same time, the financial incentive for the issuer was a function of volume, rather than the quality of the loans themselves. From the standpoint of the investors, the rule was, or should have been, caveat emptor.
A CDO primer issued by Nomura Securities in 2004 was very candid about the typical capital structure of a CDO: a pool of underlying bonds with an average rating of single-B-plus (by definition: speculative grade; poor credit quality) would be sliced and diced and find a majority of its derivative securities bearing investment grade ratings of triple-B or higher, with the largest share in the AA and AAA categories.14 This was financial alchemy of the most mysterious kind. Nomura specifically attributes the ratings transformation to “diversification,” explaining that the ratings agencies attributed constant correlations of 0.3 within any ABS sector (such as residential mortgages) and 0.1 between ABS sectors (such as mortgages and auto loans). Such an assumption makes for enormous portfolio risk reduction, as a matter of simple mathematics, justifying the Lake Wobegon effect (where all the children are above average).15
From the point of view of CDO sponsors, however, there were two driving motivations. One was the arbitrage that could be exploited between the CDO yields and the underlying debt. This result was to boost earnings. The second was that the SPE could remove assets from a bank’s balance sheet, thus reducing its requirement for regulatory capital. That freed up capital for other uses and, not coincidently, helped boost the value of the bank’s common stock equity. All from the magic of financial alchemy.
But the experiment was far from finished. If subprime loans could be securitized, and those securities used as the basis for CDOs, the CDOs themselves could be conceived of as the basis for an even more derivative security—the CDO-squared (CDO2). Between 2004 and 2008, $762 billion in CDO issuance was collateralized by structured finance instruments, qualifying as CDO2. This was 57 percent of the entire global CDO issuance over that period.16
Again, there were ingenious variations on the theme. For simplicity’s sake, though, a common approach was to separate the cash flow from the CDOs comprising the CDO2 from the market value of the security as an instrument. Thus, the scheduled payments would be isolated and ownership of the rights to the cash flow transferred to a special purpose vehicle, with risk of loss divided in reverse order of priority. These were the larger portion of the CDO universe, between 70–78 percent of issuance between 2004 and 2008, according to the Securities Industry and Financial Markets Association (SIFMA).
The remaining 22–30 percent were in “synthetic funded” or “market value” derivatives.
Synthetic CDOs do not own cash assets, but gain credit exposure via the use of credit default swaps. In this swap, the CDO receives cash payments in the form of premiums, in return for agreeing to assume the risk of loss in the event of default or other credit event. Issuance of synthetic funded CDOs jumped from $37 billion in 2004 to approximately $65 billion in both 2005 and 2006, but this market shut down abruptly in mid-2007 as subprime defaults began to take a toll. Market value CDOs, however, which were essentially trading instruments that sought to achieve capital gains from the frequent sale of collateral assets, burgeoned even as the financial crisis deepened.
In 2004 and 2005, market value CDO issuance was just $650 million and $620 million, respectively. In 2006, that soared to $43.6 billion, and in 2007 to $92.8 billion, of which $44.1 billion (47.5 percent) was floated in the second half of the year, after Bear Stearns had announced the failure of two of its hedge funds that were heavily invested in CDOs based on subprime mortgages.
What were the buyers thinking? At this point, markets had already reacted strenuously by constraining overall credit availability, beginning a “flight to safety” that was a mere glimpse of what was to come roughly a year later. But still many rushed to buy this dubious paper.
The growth of the credit default swap (CDS) market, which had critical interactions with the CDO and CDO2 markets, was even more astronomical than the swift rise of subprime mortgage, private label RMBS and CDO instruments. The first CDS was fashioned by strategists at JPMorgan Investments in 1995, and these swaps had grown to an estimated $43 trillion market in 2007, and possibly as much as $62 trillion in 2008. These are estimates since there is no central clearinghouse for credit default swaps, and the exact size of the market is unknown even at the present time. This estimate, if at all accurate, is a multiple of the world’s equity markets’ capitalization. As a point of comparison it might be noted that world GDP in 2009 has been computed at $54.9 trillion dollars by the International Monetary Fund.17
Following the glare of the spotlight on American International Group (AIG), where the CDS product failed so spectacularly, most of those involved in real estate investment—whether securitized or not—understand that while CDS is often explained as an “insurance-like product” it lacked two key elements of what most recognize as insurance. One of the missing ingredients was a sound actuarial basis for making estimates of expected loss incidence and severity. The second missing ingredient was cash reserves set aside to fund such losses in the event of their occurrence. CDS contracts were negotiated instruments, not established risk products where premiums could be based upon hard historical evidence from a broad and statistically reliable sample of default experience.18 And, interestingly, though sold as insurance, CDS were called swaps precisely to avoid the statutory reserving requirements that traditional insurance products must satisfy.19
Many—most, I would suggest—were surprised to find that AIG’s primary financial products regulator in the U.S. was the Office of Thrift Supervision (OTS). In a shrewd example of regulatory arbitrage, AIG was actually able to select OTS as its regulator by virtue of its purchase in 1999 of a small savings and loan company, Standard Pacific Savings. The OTS has subsequently acknowledged that it did not have the resources or expertise to oversee the complex and worldwide risks that AIG was taking in its financial products division. But, incredibly, the European Union’s regulators in January 2007 certified OTS as the appropriate supervisor for AIG’s business line managing credit risk. As the Roman satirist Juvenal wrote two millennia ago: Quis custodiet ipsos custodes? (Who will guard such guardians?)20
Pushing the envelope even further, AIG used ratings arbitrage to enhance its CDS business. Until the credit collapse, AIG was one of the few companies in the U.S. that had a AAA rating, indicating a likely default rate of virtually zero in the eyes of the ratings agencies. By providing credit default swaps covering securities backed by subprime mortgages, it placed those securities under the mantel of its AAA rating—effectively providing investors with the assurance that these very weak-credit mortgage securities would be backed by AIG’s enormous resources in case of default.21 Cloaking subprime RMBS with AIG’s gaudy rating calls to mind Hans Christian Andersen’s classic tale, “The Emperor’s New Clothes,” in which, remember, the emperor’s tailors were simply swindlers playing on royal hubris and public sycophancy.
In all this, behaviors betrayed insatiable appetite, a hunger for more that drove homebuyers, lenders, financial institutions and investors well beyond the bounds of prudence.22 When markets are gripped by such a dynamic, the result may well be called a mania, or a bubble, euphoria or irrational exuberance. This is merely labeling, though. To understand this phenomenon more deeply, it helps to ask if there is some underlying cause, shared by the variety of market participants, that helps explain their common behaviors. There is such a fundamental driver, I believe, and it goes by the ordinary and innocent name of growth.
The Gordon Dividend Growth Model
One of the simple and powerful equations underlying presumptively rational market pricing is the Gordon dividend growth model23 (known in financial theory as the GGM). In its simplest form, that equation is stated:
Ep = DIVi /r- g
Essentially, this model says that the expected price of an asset is equal to its periodic yield, divided by its rate of return minus the expected rate of growth. This means that, all other things being equal, the higher the expected rate of growth, the greater the multiplier on income. (Since the rate of return is in the denominator, the lower r-g is, the greater the quotient in this formula. And, of course, a higher the growth rate (as a subtrahend) the lower the term r-g will be.) The dynamics of the marketplace, especially for public companies but for private firms seeking capital as well, thus favor entities with strong growth potential by rewarding them with higher values per unit of income.
Few would quarrel with the assumptions of the GGM. Naturally, capital will flow to assets with the brightest future. The fundamental principle of anticipation says much the same thing in positing that “value is the expected future benefits of ownership” for any asset, namely, the cash flow it provides and the expected eventual selling price.
It is worth specifying how growth is actually achieved, though, if we wish to understand the concrete workings of the GGM in practice. A business can grow its bottom line in three critical ways:
- Increasing market size and share;
- Increasing margins;
- Increasing price.
All three elements were in play in the housing finance market earlier this decade. (They are still at play, in fact; the GGM is not abrogated by the fact of recession, falling prices or stressed profit margins. It just means that the numerical values plugged into the model change!) Let’s take a quick look at how these three elements were at work.
Market Size and Share
One way that growth can be achieved for any entity is by expanding its market footprint. That is especially powerful when the market itself is getting bigger, that is, when the rules of competition are not pegged to a zero-sum game. In housing finance, the increase in the U.S. homeownership rate was a powerful force. In 1988, 63.8 percent of American households owned their dwelling place. By 2004, that figure had increased to 69.0 percent. Meanwhile, of course, the U.S. population had continued to grow in absolute terms (by more than 49 million persons), so even if the homeownership rate had remained stable there would have been demographic demand for approximately 19.6 million additional housing units. Beyond that sheer population pressure, though, the increase in the homeownership ratio caused the size of the pie to grow by a further 6.1 million units. Obviously, the numbers were solidly on the side of the housing industry: homebuilders, real estate agents, mortgage brokers, bankers, and all those tied to the housing business, including furniture and appliance manufacturers, landscapers, and retailers like Lowes and Home Depot.
Thus far, those appear to be the bare facts. But we will want to understand more about the increase in homeownership. For instance, it was during this period that the baby boom generation (born 1946–1964) surged into the home-buying stage of life. The youngest of the boomers turned 25 in 1989 and 40 in 2004. It would be tempting to claim that marketing to the boomers was overly aggressive and was a factor in the deteriorating average quality of the purchasers/borrowers inflating the homeownership rate. But the facts do not bear out this hypothesis. The data show a smaller increase in homeownership share for the under-35 age cohort (3.5 percentage points from 39.6 percent in 1988, to 43.1 percent in 2004) and the 35–44 years-of-age cohort (66.9 percent to 69.3 percent, a rise of 2.4 percentage points), compared to the increase in the U.S. totals (5.2 percentage points, from 63.8 percent to 69.0 percent).
If not sheer demography, there were myriad other sources of economic pressure for increased home buying. Household resources were increasing as the stock market moved from a level of the Dow Jones Industrial Average at 1,988 at the start of the year 1988 (not a typo, just an amazing coincidence) to 10,500 at the end of 2004; and the monetary measure, M-2 (which counts funds in savings accounts, small-saver certificates of deposit and retail money market accounts) rose from $2.1 trillion to more than $5 trillion, contrary to the widespread presumption that Americans were meager savers over this period. Moreover, there were powerful regional shifts occurring as population shifted from the Northeast to the South and West. The homeownership rate in the Northeast did rise 3.6 percentage points from 1988–2004, but this was lower than the increase in the South (4.8 percentage points) and the West (5.0 percentage points). And, with the population shifts came greater political power and continued favorable tax treatment for homeowners in the form of mortgage interest and property tax deductibility from federal income taxation, power epitomized by the emergence of the soccer mom as an electoral polling category. A combination of such factors helped keep the homeownership rate rising.
In the context of generalized growth, though, an increase in market share is, ironically, an especially difficult task. Competitive firms all see the expansion in the customer base and can be expected to respond to increased demand. To gain an above-average rate of growth in an expanding market means a sustained commitment to aggressive sales. Increasing the value of the enterprise in such an environment is a daunting task and so alternative strategies for improving r-g will be adopted. That may involve taking on more risk and, if so, this places special burdens on management to evaluate the firm’s capacity to deal with the added risk. This, we have learned, is not a universal management skill.
The track record of the largest firms—that is, those successfully moving to the top of the market size/share pyramid—has been, frankly, questionable. Countrywide Financial was the nation’s largest home mortgage lender. Lehman Brothers and Bear Stearns were, respectively, the fourth and fifth largest investment banks. AIG is still the world’s largest insurance company. Citigroup and Bank of America are two of the nation’s three largest banks. And so it goes.
Increasing Margins
In the financial management of a firm, laser-keen attention to earnings and to the structure of the balance sheet provides another avenue to improving r-g. Operationally, mortgage lenders effected a tremendous cost reduction by adopting automated underwriting as standard procedure. Not only was the productivity of loan officers multiplied by reducing the amount of interviewing and credit investigation required under the old system of reviewing mortgage applications, but the primary reliance on FICO scores took out that pesky element of personal subjectivity known as judgment. The term “relationship banking” took on a rather quaint ring, suggesting the nostalgic era of Capra’s “It’s a Wonderful Life.”
The number of mortgage brokers in the U.S. increased from approximately 30,000 in 1990 to 147,000 at its peak in early 2006 (the number is now back down to 43,000). As commission-based contractors, mortgage brokers are a highly cost-effective field force for lenders. The huge rise in the number of such brokers made the early 2000s an especially competitive era. In order to make a living in this environment, brokers were incentivized to originate a large number of deals and to push toward the highest possible loan amount. This set of incentives made them behave in ways that may have differed from the behavior of salaried loan officers within financial institutions. As far back as 2001, an AARP consumer survey had revealed that mortgage brokers were twice as likely as bank lending officers to originate subprime loans.24 Harvard’s Joint Center for Housing Studies observed that regulatory oversight had not evolved as quickly as industry practices.25 “Churning” of refinancing, high upfront fees, asset-based lending without regard to income-capacity to repay, and “push marketing” are all practices raising concerns, but are margin-enhancing in the short run.
Originate-to-distribute models enabled financial institutions to book lucrative fees at every stage of the housing finance process, from the home loan itself through the entire chain of securitizations and derivatives. This improved earnings, while assuring that the balance sheet would not be burdened with long-term mortgages. The ability to arbitrage risk in the secondary markets and in derivatives also lowered the cost of funds and improved margins. The very existence of robust secondary securities markets reduced the illiquidity premium embedded in the mortgage interest rate, lowering costs for everyone. The ability to create off-balance-sheet special purpose vehicles meant that capital reserve requirements could be mitigated, again raising overall margins on measures such as return on assets. From the standpoint of maximizing the impact of r-g, this was all good.
It does go without saying that consumers learned to play the margin game pretty sharply themselves. The automation of the mortgage process commoditized the industry and had the additional effect of detaching borrowers from lenders as well. Consumers seeking mortgage credit shopped for the best available deal. They learned to see their mortgage as a “tradable instrument” able to be refinanced frequently as interest rates and housing prices shifted in their favor. They learned that fees could often simply be added to the principal amount of the loan, and that the required level of down payment was definitely a negotiable figure. And, most of all, they discovered that so eager were lenders to do business, constraints that formerly discouraged them from seeking a mortgage loan might not apply any longer: a situation apotheosized by the NINJA (or “no-doc”) loan—No Income, No Job or Assets? No problem!
On the business side of things, the improvement in margins worked through the GGM as predicted. The S&P Financials Index rose from 372 in May of 2004 to 508 in February 2007, a 37 percent increase in 33 months. It worked—until it didn’t: by March of 2009, this index was down to 82.
Increasing Price
One of the classic definitions of inflation (attributed to Milton Friedman) is “too much money chasing too few goods.” Inflation has often been viewed as favoring real estate assets, and there remains considerable truth to that perspective—when it is understood clearly. Over the long term,26 in income-producing properties, rents must rise to reflect the inflation-influenced expenses of operations. Likewise, the replacement value of properties—which reflects inflation in the cost of building materials and labor—will rise over time, since during times when market value is lower than replacement cost, no building will occur and prices will rise to reflect the relative scarcity of new commercial properties in the marketplace. In housing, too, prices will reflect changes in household incomes as well as the impact of the cost of production of new homes.
Nevertheless, the mispricing of assets is constitutive of a bubble, almost as a matter of definition. Scholars and industry professionals are now examining the relationship of asset pricing to general inflation with renewed interest.27 The separation of asset values from underlying economic fundamentals in housing was identified relatively early by Robert J. Shiller in 2005, long before the bubble reached its maximum magnitude.28 In the world of stocks, the ability to grow earnings based on rising home prices affected a multitude of firms in housing, in housing-related finance, in retailing, and even in manufacturing.
There is a kind of “fallacy of serial correlation” that encourages the unwary to anticipate that what goes up will continue to go up. This is also popularly known as the Great Fool Theory: I might be a fool to pay this price, but when I want to sell there will be an even greater fool who will pay an even higher price. So stated, it seems almost laughable. (Laugh until you cry.) But such an expectation was behind tulip mania in the seventeenth century and the South Sea bubble in the eighteenth century,29 as well as the dot-com bubble and the current financial crisis in our own times. An inflated expectation of price increase translates, in the GGM, into an unsustainable inflation in asset prices. We are now living through the painful correction of the resulting excesses.
Conclusion
Having stepped back and examined the metastasis of subprime mortgage lending into a global credit crisis, and having suggested that the bias toward growth drives capital pricing in all asset markets, whether in boom times or busts, we must still pose a soul-searching question as to how we have arrived at the present sorry condition.
It is clearly not for want of technical skills or analytical capabilities that we traveled down the road to this crisis. Nor is it for want of information (although asymmetrical information did, no doubt, play a role in the market interactions—from the selling of subprime loans to unsophisticated borrowers to the purchase of AAA paper by those who had little idea of how that rating was determined). For at least two decades, the “best and brightest” have flocked to our business schools, and the top graduates have disproportionately gone into the investment industry rather than to the corporate world that produces “stuff ” or into the not-for-profit sector.
I have long felt that our shortcomings have been due less to the quantitative skills taught in our universities and deployed in finance than to our inattention to developing good judgment.30 Though there have been failures in applying what is available in financial theory (e.g., the distinction between systematic risk and idiosyncratic risk; the fundamental relationship between household income and housing affordability; the basics of underwriting credit), these have not been failures of knowledge, but of behavior.
Some of our choices could be much better informed were we to commit to a broader understanding of decisionmaking, good and bad. The case study method of learning is intended to promote this, but often devolves to mere calculation. Decisions, it should be understood, are not the application of mathematic formulae but are activities of a personal intelligence. Here’s a critical insight: in using math, everyone should come to the same conclusion; insightful decisions, on the other hand, should enable a person to break away from the herd.
Judgments also require standards. As a result of the survey cited in endnote 12, a panel of Counselors of Real Estate prepared the following rules, which we commended to those in attendance at the CRE organization’s national meeting in November 2008. I think these prescriptions are worthy of wide attention, in academic settings and in the real estate financial industry. I commend them to your reading and reflection.
Ten Commandments for 21st Century Real Estate Finance
- Write upon thy heart the law that “reward” and “risk” shalt always appear in the same sentence.
- Make neither markets nor regulators into idols, and follow not false prophets of simplistic bias.
- Be sober and watchful, lest the enemy of massive loss approach like a thief in the night.
- Honor thy father and thy mother’s ancient counsel: Keep It Simple, Stupid!
- If thou wilt not do thy own credit analysis, then vow to invest not at all.
- Thou shalt not adulterate thy portfolio with excessive leverage.
- Thou shalt not bear the false witness of hidden assumptions in thy investment underwriting.
- Thou shalt not covet for the short term, yea, but shalt lay up thy treasures for length of days.
- In all things, yield not to the tempter’s snare of panic.
- Remember that, after thy exile in the wilderness, if thou heedest these commandments, thou shalt once again return to the land of milk and honey. •
Editor’s Note: portions of this article have appeared in The Stamford Review
Endnotes
1. See, for example, the classic John A. Mackay, Extraordinary Popular Delusions and the Madness of Crowds, Harmony Books (New York, 1980), originally published in 1841. See also John Kenneth Galbraith, A Short History of Financial Euphoria, Penguin (New York, 1994). More recently, Charles P. Kindleberger and Robert Z. Aliber, Manias, Panics, and Crashes: A History of Financial Crises, John Wiley & Sons (Hoboken, N.J., 2005). ↩
2. Hugh F. Kelly, Real Estate Finance and Banking Practices in the United States 1970–1986, (study performed for confidential client], Landauer Associates (New York, 1986). This report records the more specific issue: “…a management decision to pursue arbitrarily determined origination and yield targets. The bank’s ambitious program to grow its asset base and fee earnings was not attainable within the underwriting guidelines for the highest quality loans. Loan officers therefore moved ‘down-market’.” (p. 69). As the authors cited in endnote 1, the background of “bubbles” has a consistent leitmotif. ↩
3. See Roger Lowenstein, When Genius Failed: The Rise and Fall of Long-Term Capital Management, Random House (New York, 2001). ↩
4. Now widely discussed thanks to the publication of NassimTaleb, The Black Swan: The Impact of the Highly Improbable, Random House (New York, 2007). ↩
5. I prepared “The Subprime ‘Emergency’” for American Realty Advisors (June 2007), which acknowledged the distress but saw the subprime defaults as geographically concentrated and tractable within the broader credit markets. In November 2007, I prepared the quarterly newsletter for Real Estate Capital Partners, which depicted the mortgage crisis as a “product failure, not an industry failure.” Following the model of the 1990s derivatives crises, I projected the period of “correction” as taking approximately one year. ↩
6. Misery loves company. I wasn’t alone in this judgment. The Chicago Fed Letter for August 2007 looked at these same figures and concluded, “The rest of the mortgage market … has not experienced a similar hike in delinquency rates … reducing the likelihood of any spillover effects on the rest of the mortgage market.” See also the Mortgage Bankers Association monograph, “The Residential Mortgage Market and Its Economic Context in 2007,” (Jan. 30, 2007). ↩
7. Allen Frankel, “Prime or not so prime? An exploration of US housing finance in the new century.” BIS Quarterly Review (March 2006), pp. 67–78. ↩
8. “How Painful Will Mortgage Rate Resets Be?” Consumer Watch U.S., CIBC World Markets, Oct. 18, 2006. ↩
9. Frankel, art. cit., p.68. ↩
10. Anthony Downs, Niagara of Capital: How Global Capital Has Transformed Housing and Real Estate Markets, Urban Land Institute (Washington, D.C., 2007), pp. 17–29. ↩
11. Ibid., pp. 90–92. ↩
12. See, for example, the discussion by Charles W. Calomiris, “The subprime turmoil: What’s old, what’s new, and what’s next,” on the Economics website VOX. Calormiris’ essay is dated Aug. 22, 2008, and is accessible at http://www.voxeu.org/indes.php?q=node/1561. An independent survey of members of The Counselors of Real Estate organization, performed in October 2008, showed that respondents concurred that investors shared the blame with the rating agencies for missing the fundamental problem of risk. The present author has discussed this survey in “Truth and Consequences: Harsh Light on Responsibility in the Financial Crisis,” RERC Real Estate Report, Winter 2009, Vol. 37, No. 4, pp. 29–32. ↩
13. The CDO has a suspect pedigree. The first collateralized debt obligation was issued in 1987 by Drexel Burnham Lambert for the Imperial Savings Association. Drexel Burnham collapsed in 1990 in the wake of insider trading scandals that sent financier Michael Milken to prison. Imperial Savings became insolvent in the summer of 1990, and was taken over by the Resolution Trust Corporation. ↩
14. “CDOs in Plain English,” Nomura Fixed Income Research, Sept. 13, 2004. ↩
15. In my classes in Real Estate Economics and in Risk and Portfolio Analysis, I frequently explain the difference between mathematics, where numbers are just numbers (i.e., abstract quantities) and economics, where every number must represent something that exists in the world. The putative correlations employed in CDO rating were, in my opinion, truly abstract math and not economically grounded. ↩
16. Author’s calculation from SIFMA data on global CDO market issuance. ↩
17. International Monetary Fund, World Economic Outlook, (April, 2009). ↩
18. John J. Schneider and Daniel S. Bender, “The Impact of Regulation on Credit Default Swaps,” Navigant Consulting, confidential report issued 2008. ↩
19. The New York State Department of Insurance, in fact, issued a ruling on June 16, 2000 that a CDS was not a contract of insurance. Alan Greenspan, then Fed chairman, had testified in July 1998 to the House Committee on Banking and Financial Services that over-the-counter derivatives contracts like CDS did not merit regulation under the Commodities Exchange Act. New York State Insurance Commissioner Eric Dinallo testified in October 2008 that, were it not for a specific exemption granted to CDS by the Commodities Futures Modernization Act of 2000, the NYS Insurance Department would have prosecuted so-called “naked” CDS (i.e., swaps where the swap purchasers do not own the underlying obligation) under state gambling and bucket shop laws. There are overtones of a famous Keynesian dictum: “When the capital development of a country becomes a by-product of the activities of a casino, the job is likely to be ill-done.” ↩
20. This seems to be a very good time to be reading Juvenal, who also wrote Rara avis in terris nigroque simillima cycno (A rare bird on earth, comparable to a black swan). Liberal arts education continues to be vindicated by the perennial relevance of the classic authors! ↩
21. There has been a wealth of good reporting on AIG’s use of regulatory and rating arbitrage, notably by the New York Times’ Joe Nocera (“Propping Up a House of Cards,” Feb. 28, 2009), the Washington Post’s Dennis Brady (“Senators Call AIG ‘Lost Cause,’” March 6, 2009), and Daniel Wagner of the Insurance Journal (“How AIG Fell Through the Regulatory Cracks,” March 9, 2009). The Washington Post has also noted that the very compliant OTS was the regulator of Countrywide Financial and Washington Mutual, two of the most aggressive of the subprime lenders. (Binyamin Appelbaum and Ellen Nakashima, “Banking Regulator Played Advocate Over Enforcer,” Nov. 23, 2008). ↩
22. For a sober and prescient investigation of the tendency of desire to outstrip prudence, see Laurence Shames, The Hunger for More: Searching for Values in an Age of Greed, Times Books (New York, 1989). ↩
23. Named after Myron J. Gordon, and published in “Dividends, Earnings and Stock Prices,” Review of Economics and Statistics, 41, (May 1959), pp. 99–105. ↩
24. Kellie Kim-Sung and Sharon Hermanson, “Experience of Older Refinance Mortgage Loan Borrowers: Broker- and Lender-Originated Loans,” AARP Policy Institute Research Report. January 2003. ↩
25. Joint Center for Housing Studies, The State of the Nation’s Housing, 2002, (Cambridge, 2003). ↩
26. This is always a red flag in an economic discussion, of course. Keynes famously pointed out that “in the long run, we are all dead.” ↩
27. For a particularly acute discussion of this general subject, see Marc Thompson, “Managing Risk in Income Property Loan Portfolios,” Real Estate Issues, Vol. 34, n. 1, 2009, pp. 21–30. ↩
28. Shiller posted a blog about this on April 12, 2005 on http://housingbubble.blogspot.com/2005/04/housing-bubble-willpop.html. ↩
29. See John Mackay, op. cit. ↩
30. Previous writings on this subject have included Hugh F. Kelly, “Can Universities Teach Real Estate Decision Making?” Real Estate Review, Vol. 20, n. 2, Summer 1990; “Dimensions in Real Estate Research,” Real Estate Review, Fall 2001; and “Judgment: Imagination, Creativity, and Delusion,” Existenz, Vol. 3, n. 1, Spring 2008. ↩