 February 2020: Flooding from Storm Ciara in York, UK. Photo: M Barratt/Shutterstock.com
 The CRREM project has received funding from the European Union’s Horizon 2020 Research and Innovation programme under grant agreement no. 785058.
In these times of COVID-19, our perspective of time has changed. Therefore, it might seem a long time ago that we had river floodings after storms Ciara and Dennis in February, Australian and Californian bushfires, and the declaration of ‘climate emergency’ as the 2019 word of the year by Oxford Dictionaries. Each of these highlights the seismic shift in public opinion and increased media, government, and investor focus on Environmental, Social, and Governance (ESG) issues. As the effects of climate change are already more intensively felt around the globe in the form of increasing frequency and severity of extreme weather events, the social motivation for a transition to a low-carbon economy is peaking. As the fight against climate change continues, one method of mobilising consists of aligning consumption behaviour and investment allocation with the goals of the 2015 Paris Agreement and meeting the recommendations of the Task Force on Climate-related Financial Disclosures (TCFD).1, 2 New government policies around the globe (and perhaps in the U.S. as well) are now being backed by precise scientific research which are already impacting on consumer, corporate and investor decision making. Different projects and initiatives focussing on ways to tackle climate change are underway. For most or almost all of them, the Paris Agreement sets the ultimate target committing signatory governments to policies aimed at keeping a global temperature rise this century well below 2 degrees Celsius.
As real estate (directly and indirectly) contributes approximately 36% of greenhouse gas (GHG) emissions globally, a deep understanding of climate change-related risks for the commercial real estate sector is starting to develop. Climate change risks include both direct physical and indirect transitional risks, encompassing threats of rising costs due to the pricing-in of carbon emissions and further factors such as higher energy cost, stringent building codes, shifting market expectations and economic obsolescence. More IT-based instruments are emerging to limit, manage, and help improve exposure to these transition risks.
The new Carbon Risk Real Estate Monitor (CRREM) Risk Assessment Tool is a practical tool that was developed as part of the CRREM project that focuses on climate change risk management.3 Building on the project’s initial European focus, CRREM has started providing specific targets for countries outside Europe, including North America and Asia-Pacific while differentiating between the different property types such as office, retail, logistics and the residential sector. This latest global phase of the initiative was funded by some of the largest global pension funds and investors in commercial real estate: PGGM, Norges Bank Investment Management, APG, Ivanhoé Cambridge, and Japan’s Government Pension Investment Fund.
The project was originally launched and supported by the European Union’s Horizon 2020 Research and Innovation programme, consisting of a consortium of five well-known European academic institutions including the IIÖ Institute for Real Estate Economics, Tilburg University’s TIAS Business School, Ulster University, GRESB, and the University of Alicante.
The CRREM Tool provides a solution to the challenges of the commercial real estate sector with regard to aligning with the Paris targets (to limit global warming to below 2°C or even 1.5°C by 2050) and thus mitigating transition risks. CRREM also provides the industry with science-based decarbonisation pathways, covering both annual energy as well as carbon-intensity trajectories for numerous commercial property types. It provides investors and stakeholders with a clear roadmap for individual assets or portfolios on how to reduce the individual carbon footprint until 2050, limiting possible transition risks exposure.
The CRREM tool allows investors and managers to measure the risk of individual property and portfolios’ non-compliance with stricter future energy and GHG reduction targets, which will likely trigger assets to become “stranded” in the short- or mid-term.4 So-called “stranded assets” are properties that require costly capital expenditure by being exposed to the risk of early economic obsolescence due to climate change, as they will not meet market expectations and/or future regulatory efficiency standards. The CRREM tool incorporates that benchmark for individual building’s carbon performance against the Paris aligned decarbonisation pathways to provide a carbon risk analysis including the year of stranding, excess emissions, carbon and energy costs. Each asset’s baseline emissions are calculated including the climate and grid-asset performance over time (in terms of GHG intensity per square metre). Results including the analysis of the carbon performance can be displayed for single assets as well as on an aggregated (portfolio) level.
With COVID-19 related issues proving a distraction for many governments, it seems likely that GHG targets are not met by their future specified dates. Therefore, national policies are likely to soon become even stricter in enforcing their targets and policies. This would boost the financial risk of non-compliance significantly. In the meantime, investors themselves are already implementing better energy efficiency and GHG intensity reduction in line with the emerging new software solutions, methods and industry lead initiatives.
This article aims to explain the transition-related climate risks in particular and illustrate the potential use of CRREM, in order for investors to control downside-risks as far as possible. In the remainder of the article, we will focus on outlining the transition from energy performance to GHG emissions and furthermore focus on the pathways for the specific sectors and countries. We will close with an example of the practical implications of decarbonisation pathways for a global portfolio.
Transition Risk – Moving from Energy to GHG Intensity Targets
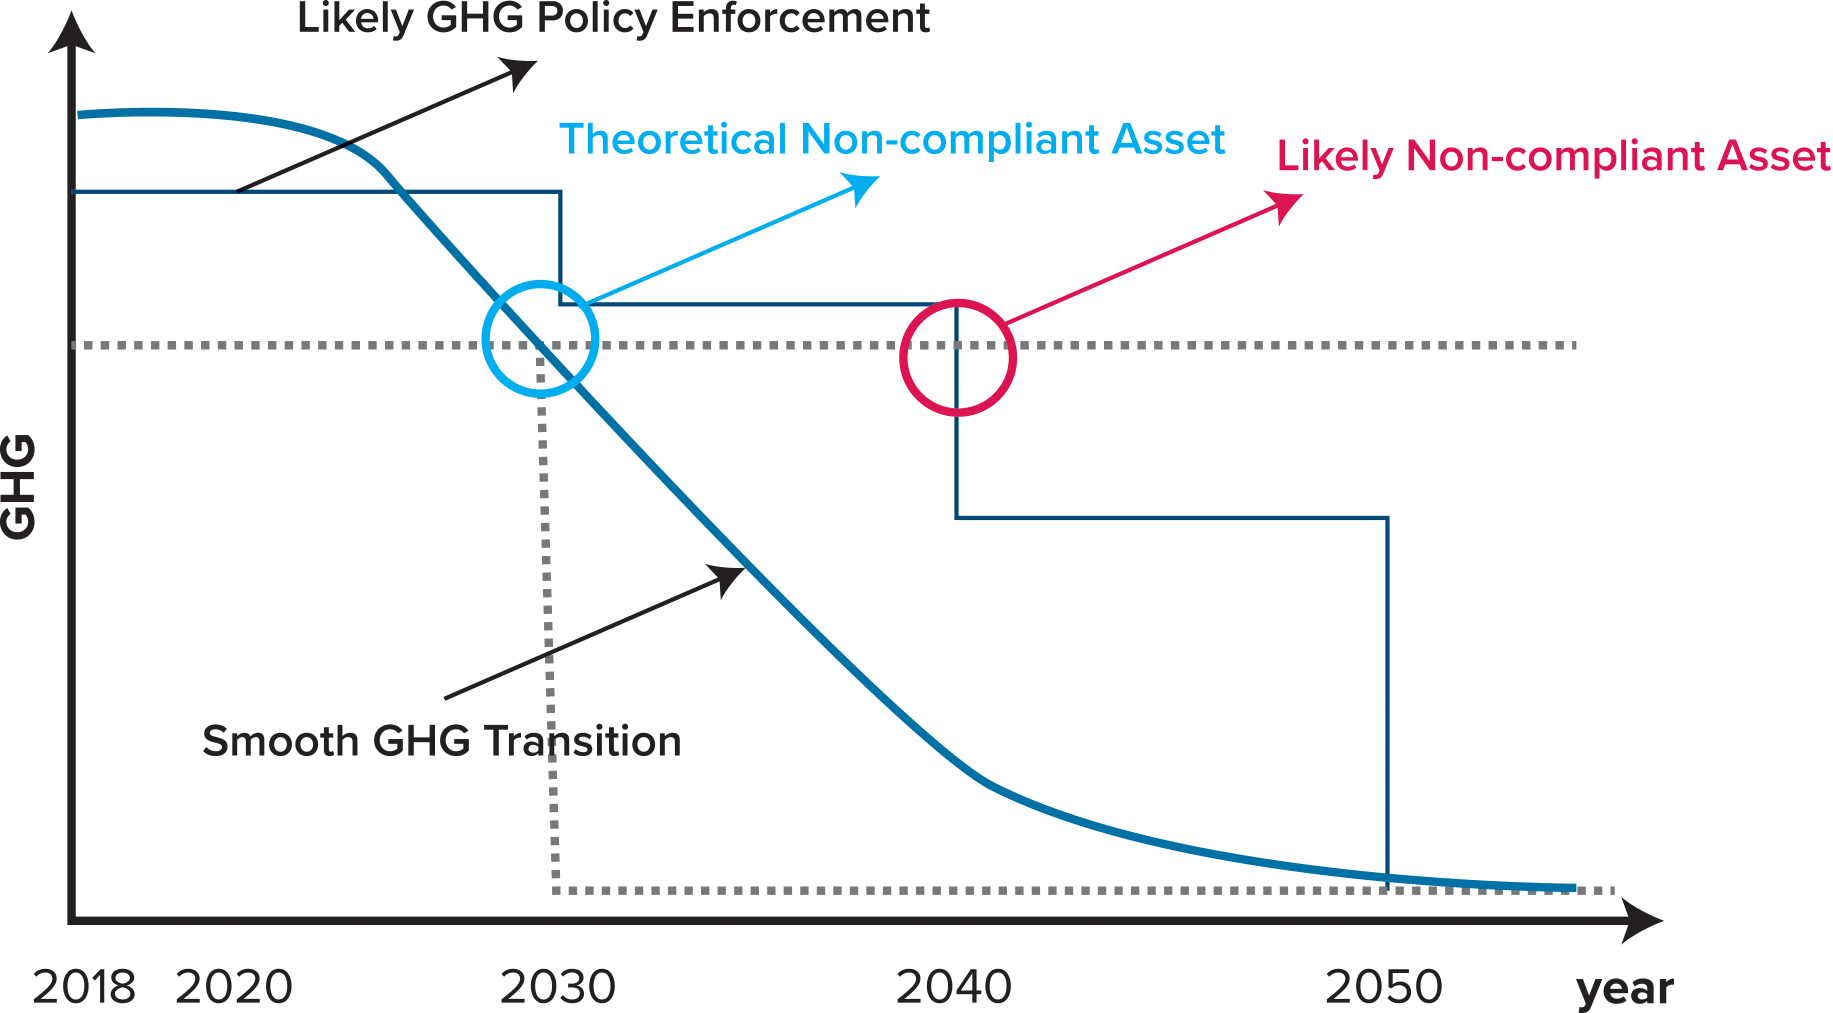
Already in 2010, the EU adopted the Energy Performance of Buildings Directive (EPBD) aiming to achieve a highly energy-efficient and decarbonised building stock by 2050. Further European directives set milestones for 2020, 2030, 2040 and 2050 in order to align the Nationally Determined Contributions (NDCs) with the Paris targets. The EPBD requires countries to set cost-optimal minimum energy performance requirements for new buildings, the renovation of existing buildings and for the replacement of major building elements (HVAC, roofs, etc.). New buildings are also required to be nearly zero-energy buildings (NZEB) from year-end 2020. These energy reductions are already set in national laws and building regulations of the European member states. However, regulators are lately shifting their focus from energy reductions towards the more precise GHG intensity measures. Figure 1 illustrates the risk of an asset becoming “stranded” by non-compliance. The smooth blue line represents the decarbonisation pathway aligned with the Paris targets that the asset is benchmarked against. The horizontal grey line shows the current stable GHG intensity of an existing building. At the start the asset is compliant; however, it soon intersects and reaches levels above the blue line.
Figure 1: Stepped Regulatory Enforcement to Delay Transition Risk
Source: Authors’ representation, CRREM
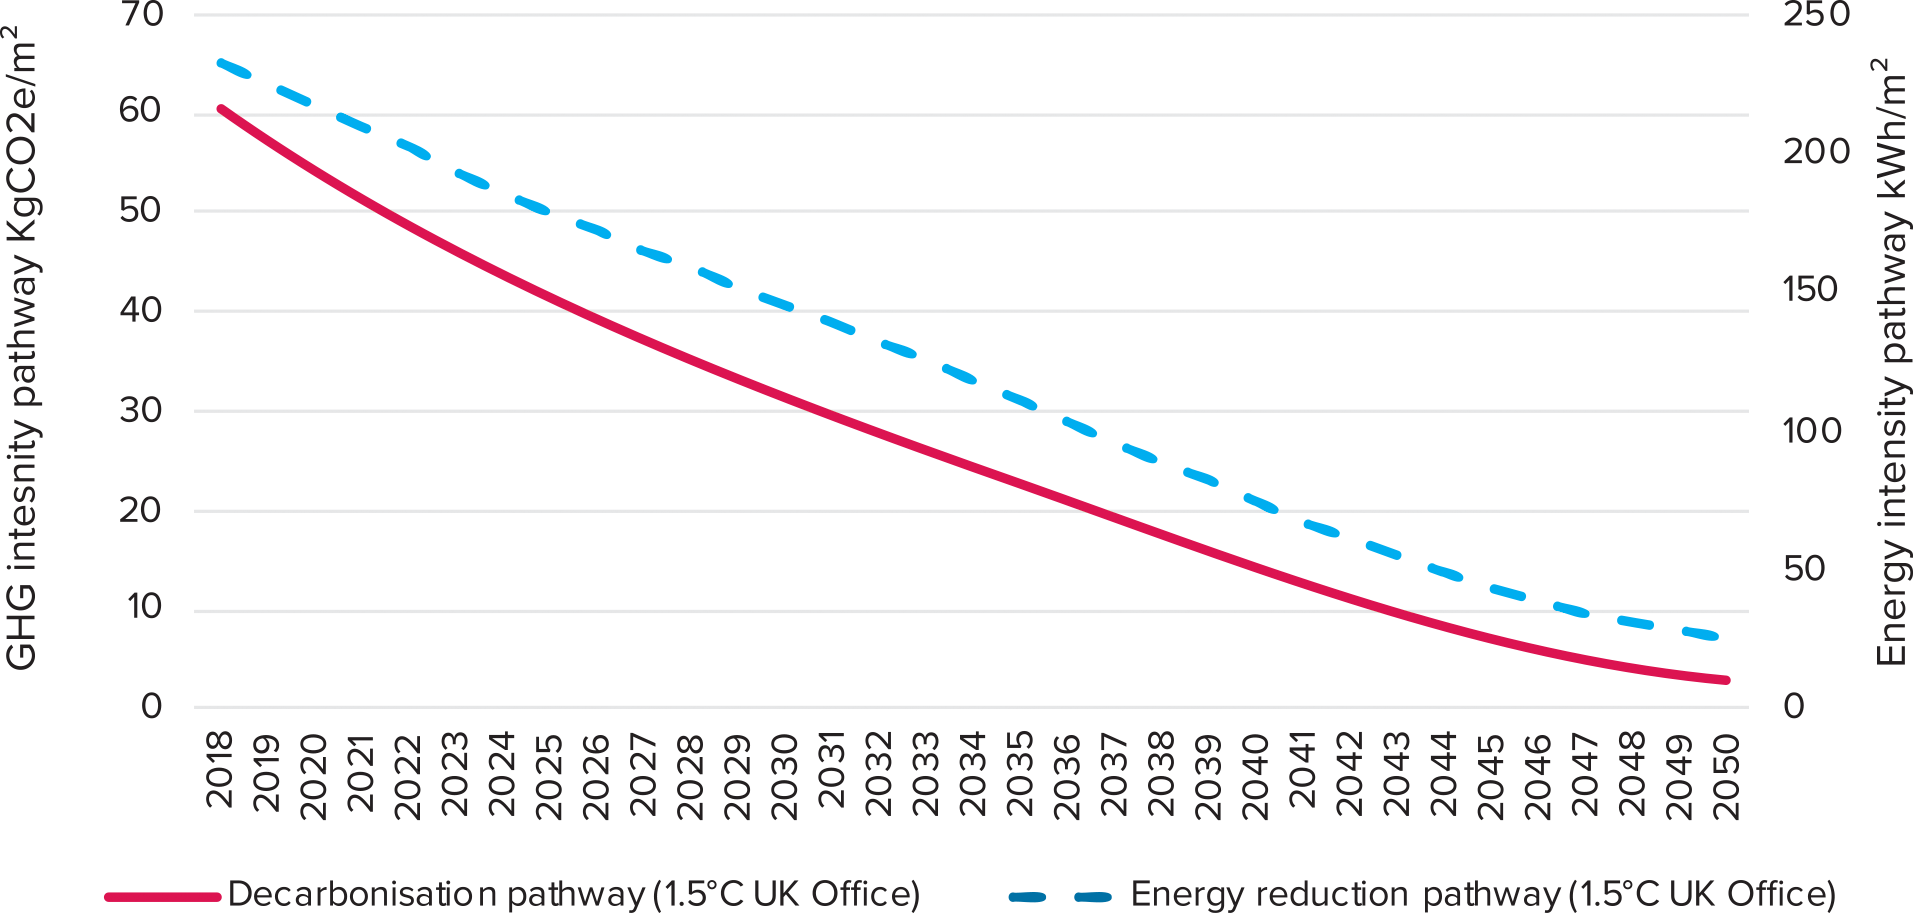
With regulators switching, the logical next step for policy is to align climate change by moving from energy use intensity as an input towards GHG intensity as an actual carbon output. To illustrate this difference, we take the UK as an example in Figure 2 and show the energy reduction as well as GHG pathway for the 1.5°C UK office sector target by using the Carbon Risk Real Estate Monitor (CRREM) data. There is a similar trend between energy use and GHG pathways, showing a smooth downwards curve until 2050. Existing and future grid decarbonisation can drive the GHG pathway despite a lower reduction in actual energy use. Generally, the development of (1) energy sources used for real estate (switch to renewables) and the evolution of the (2) emission factors of the respective energy sources are two of the driving forces for differences.
Figure 2: Switching from Energy Intensity Input to GHG Intensity Output
Source: CRREM
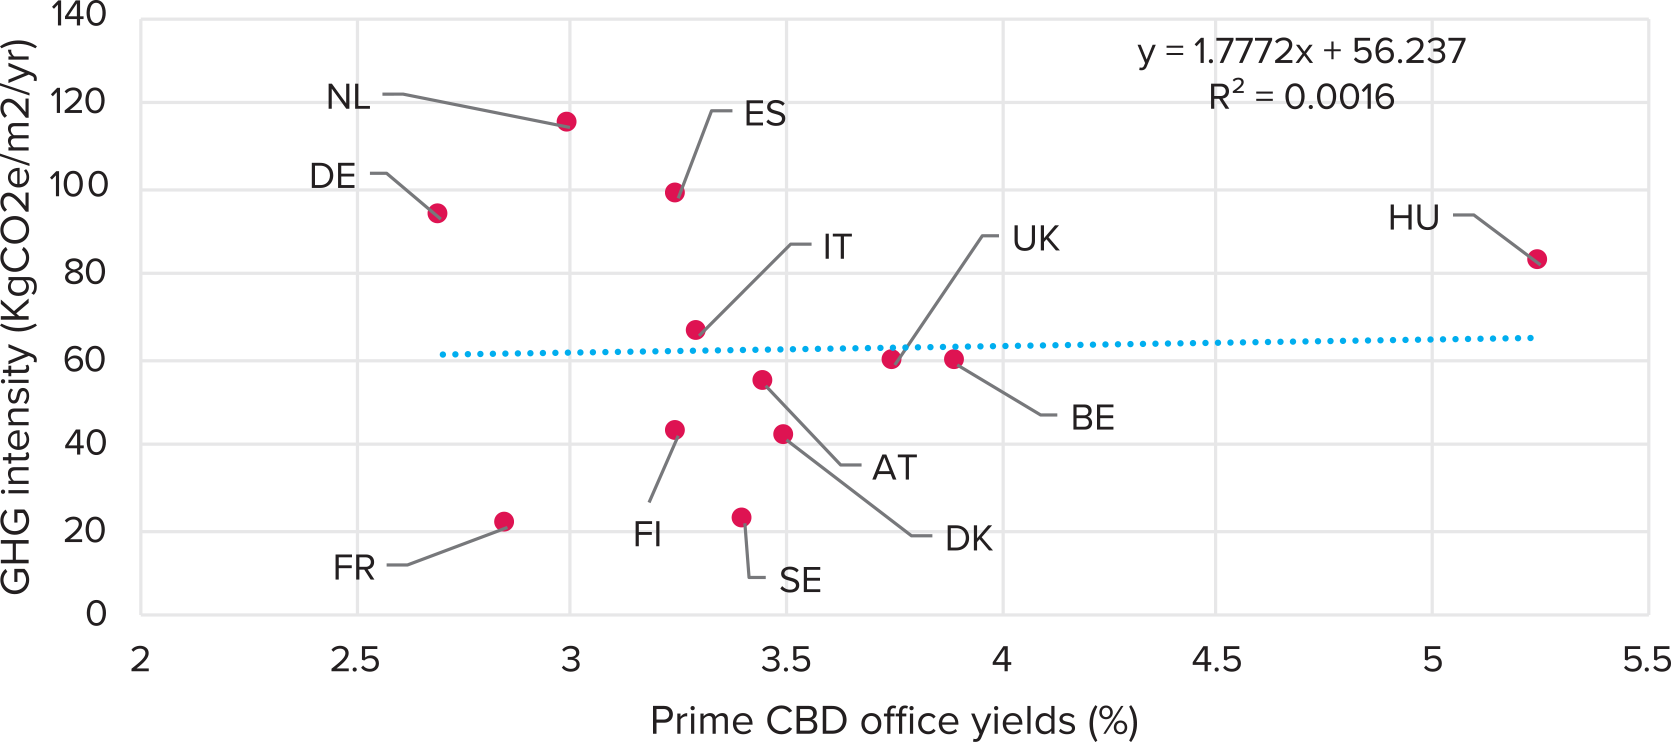
The natural question that arises is: Are investors pricing transition risks accordingly while using GHG intensity pathways? To get a first glimpse regarding a potential answer to this question, we looked at the market pricing in European office markets versus the average GHG intensity per square meter in the respective markets. One would expect that an investor needs to be compensated for taking a higher GHG intensity per square meter with everything else being equal (ceteris paribus). However, Figure 3 shows the absence of any correlation between prime office yields and GHG intensity. Of course, many other aspects are impacting yields and further (market) risks play a role as well. Further research is needed that incorporates other risk premia to isolate the impact of transition risk (e.g. do a more profound analysis using regressions and hedonic pricing models in order to ensure a ceteris paribus comparison). Rather than considering markets in different climate zones, a property-specific comparison within one of the markets might be a logical next analytical step. Of course, also the different national regulations regarding potential carbon pricing impacts on real estate are at different stages, so this will further impact market expectations and sensitivity to carbon-related impacts. Differentiation of asset outputs in terms of compliance with the carbon intensity goals (kgCO2/m2/yr) and/or energy intensity goals (in terms of kWh/m2/yr) is important as properties with low carbon intensities may still have high energy intensities in regards to kWh per square meter. Recent research and empirical studies assess the magnitude of the value effects of energy retrofits, review the economics of energy efficiency retrofits vie empirical studies including green premia and the causes of brown discounts.5
Figure 3: Current Prime Office Yields Do Not Reflect GHG Intensity
Source: AEW, CRREM
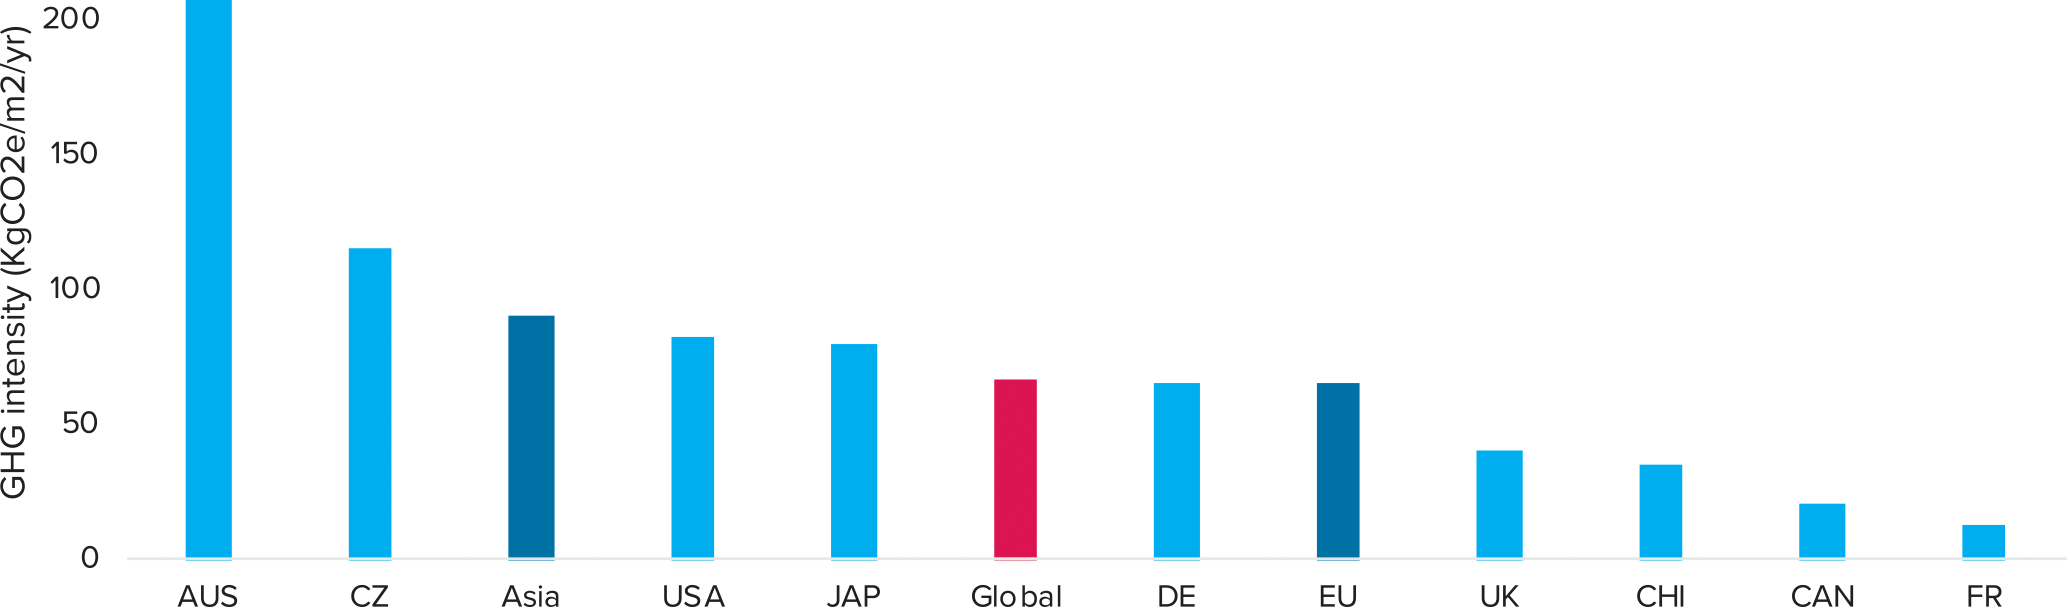
The Paris Accord, as outlined in the introduction, implies a maximum global carbon budget for the total anthropogenic amount of GHG to be emitted until 2050 to not exceed 2.0 degrees Celsius global warming through to 2100 (this equates to 890 GtCO2e (Friends of the Earth) and 1,259 GtCO2e (IEA 2DS) of emissions to stay in line with the 1.5°C and 2°C targets respectively. This total budget is translated using scientific-based approaches into a global real estate sector budget and the basis for the reduction in GHG for each country. Figure 4 shows the wide geographical dispersion in 2020 in the required GHG intensity reduction by 2050 with the global real estate average around 66 kgCO2 of emission per square meter per annum. Countries such as France, Denmark and Sweden benefit significantly from either their high nuclear or renewable energy mix as their required GHG intensity reduction is lower.
Figure 4: GHG Intensity Reductions to 2050 Vary Widely Across the Globe in kgCO2e/m² for 2°C
Source: AEW, CRREM
However, governments in Asia and a number of CEE countries (Central and Eastern Europe) have much more to do in this respect as the reduction intensity is much higher. It is important to note that it might not always be clear where the legal responsibility rests to reduce the properties’ GHG intensity: Landlord, tenants, national regulators, local governments or even other industry sectors (e.g. related to the decarbonization of the electric grid).
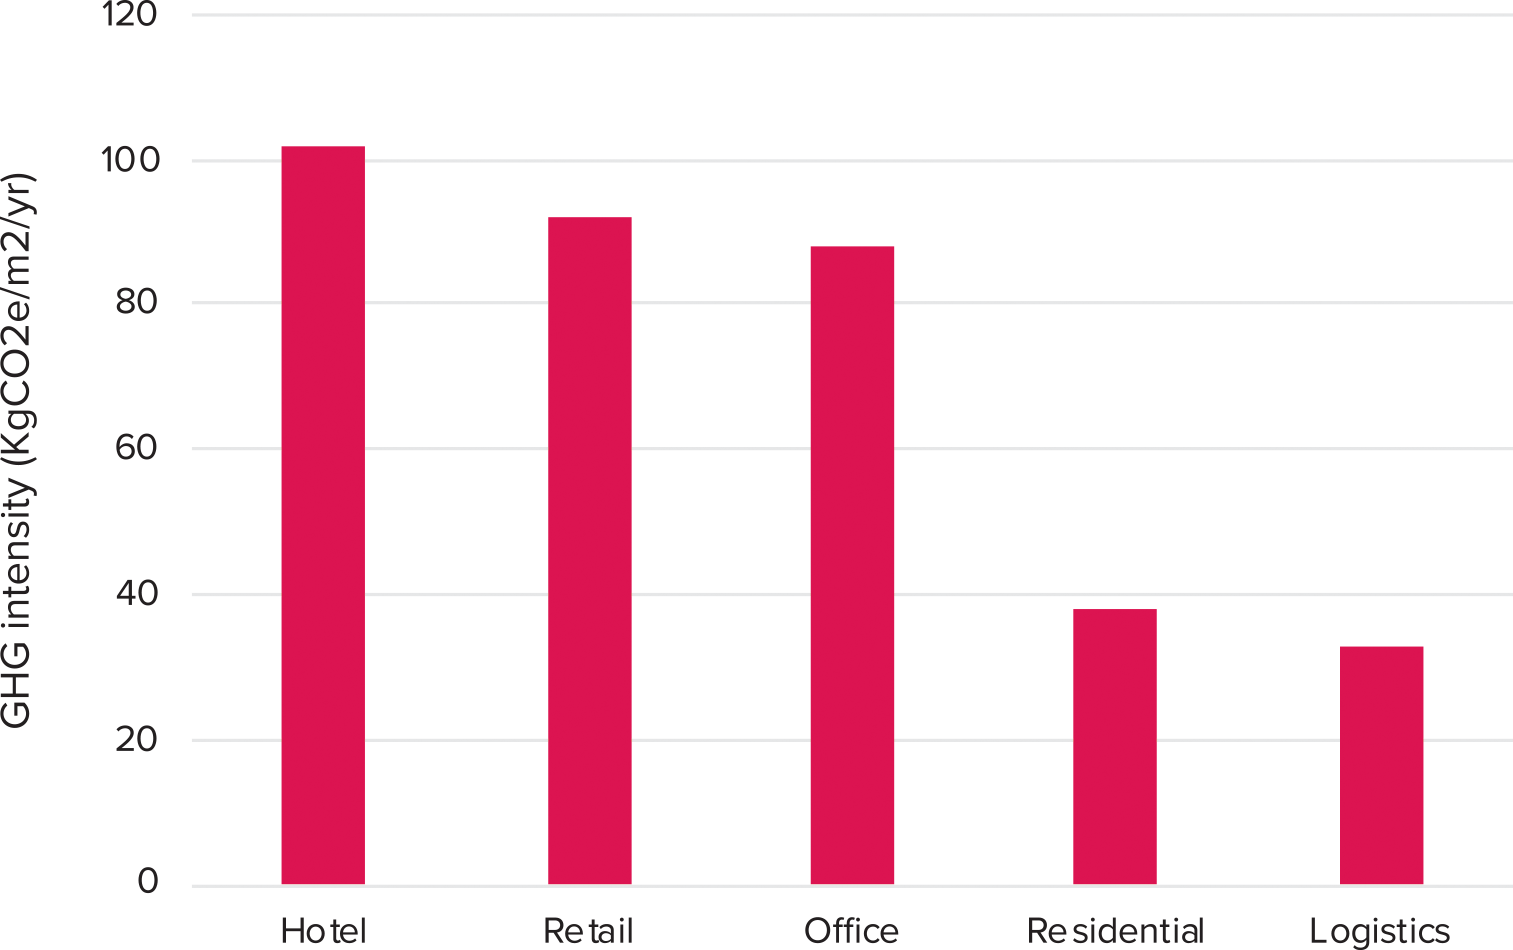
In addition to this geographical dispersion, the difference in GHG intensity between property types is noticeable. To allow a comparison, we look at the GHG intensity per property sector on a global average. Figure 5 shows that hotels with an average of around 102 kilos of GHG emissions per square meter per annum have the highest intensity while logistics is just below residential with the lowest average of around 33 kilos of GHG. However, a number of property types which are not shown, such as data-centres and hospitals, have a higher intensity per square meter. Of course, one has to accept that due to the property-specific characteristics also in 2050, those relative differences in energy intensity (and GHG intensity) will to some extent remain the same.
Figure 5: GHG Intensity Varies Not Only By Country But Also By Property Type
Source: AEW, CRREM
What Does It Mean in Practice?
To illustrate the implications and practical use of the aforementioned pathways and GHG intensity, we consider a three-asset portfolio and compare its current asset-level GHG intensity pathways versus the sector and country-specific GHG intensity future pathway. If the asset-level pathway is higher than the country sector-specific pathway, the asset is considered to be non-compliant and potentially stranded. Our three-asset portfolio assumes: (1) Logistics building in Australia (Net operating income per year €750,000); (2) Shopping Centre in the USA (Net operating income per year – €1,750,000) and (3) Office building located in the Paris region (Net operating income per year – €2,500,000).
No rent indexation or capital expenditure is assumed. If we evaluate the logistics asset in Australia, i.e., the red dotted line in Figure 6, we observe that the asset-specific pathway intersects with the sector country-specific (straight red line) pathway already now (indicated by the light blue circle). This means that from today onwards the GHG intensity of our logistics asset is above the pathway, marking the asset non-compliant. If we then switch to the American Shopping Centre asset (the blue dotted versus straight line), we observe that the pathway convergence is 12 years later in 2030. Finally, if we look at the French office asset, i.e. the yellow dotted line, it intersects with the country-specific pathway in 2023. This difference in the intersection is driven by both the country-sector specific decarbonisation pathway as well as the current (and projected) GHG intensity pathway of the assets. Note that even though the shopping centre might have the highest overall GHG intensity, it will still be in line with market expectation for a long time since the asset class and country are relevant for the benchmark. In the next step, we quantify this non-compliance risk for our portfolio in terms of a percentage of net operating income (the grey shaded area). We see that already 65% of our net operating income comes from non-compliant assets by 2023 and this reaches 100% in 2030.
Figure 6: Timing of Transition Risk Across Different Asset Segments To CRREM
![]()
Source: AEW, CRREM
The pathways allow investors to investigate the impact of the GHG intensity pathways on single-assets and portfolios. For a strategic perspective on asset allocation one can derive answers to the following questions:
- At what point in time is my asset not compliant with market expectations and regulation regarding the carbon intensity?
- How might the financial impact of carbon taxes/carbon prices factor in?
- How high is the trade-off between investing in energetic retrofit (now or at some point in the future) and the “do-nothing” alternative with regard to financial and ecological “pay-back”?
- Might a disposal of the asset today be the best alternative (as e.g. market sensitivity regarding this topic is still limited)?
- Does my portfolio have a good balance over time regarding stranding risk or do we face a concentration of risk clusters over time?
- When is the best timing for a retrofit action in regard to the refurbishment cycle, availability and timing of future sales (if intended)?
Based on our views, non-compliance with EU-determined future energy and GHG reduction targets is unlikely to trigger assets to become stranded in the short term, given that current national legislation is delayed and the level of fines is very low. However, when GHG targets are not met at the specified dates, EU and national governments are likely to become stricter in enforcing their targets and policies. This could increase the financial risk of non-compliance significantly. We observe that the EU Sustainable Finance Action plan and the regulatory initiatives based on this plan like clarification of taxonomy, increasing benchmarking of ESG-related aspects and higher transparency requirements for ESG who are supporting this development.6 The current recommendations of the TEG in alignment with the TCFD initiative place a focus on carbon- and GHG intensity goals for real estate, proposing various measures to increase transparency and improvements for low-carbon investment strategies.7 All in all, this highlights the need for a market-based policy such as carbon taxes, increased transparency for investors and/or an obligation for funds/listed companies to reveal the carbon footprint of their holdings in order to accelerate the decarbonisation of commercial real estate. The various measures are:
- Switching from traditional energy providers to renewable energy providers for high-intensity assets or for entire portfolios through more central procurement, which gives owners more leverage in negations;
- Active asset management initiatives to reduce more energy use by installing smart meter systems, interactive heat monitoring and installation of LED lighting;
- Significant capital expense projects such as wall and roof insulation, double glazing, solar panel installation and M&E services upgrades.
Conclusion
Real estate assets face significant climate change-related risks. Up to this point, they have lagged other industry sectors with respect to initiating and developing roadmaps towards tackling transitional risk associated with climate change and stranding assets. The point of stranding is when the asset’s performance in terms of the GHG intensity is higher than the decarbonisation target. From this point onwards, the asset produces excess emissions, exceeding the maximum allowance per square meter. The economic obsolescence is associated with the stranding date; the higher the excess emissions, the greater the probability of economic obsolescence occurring. Stranding risks can be overcome by undertaking retrofit actions in order to fulfil the emission target again, enabling a long-term future-proof performance. Besides asset underperformance, the strategic timing of retrofit actions should also be subject to the refurbishment cycle (exploitation of possible synergy effects), availability and the timing of future sales (if intended).
Funded by the European Union under its Horizon 2020 programme for Research and Innovation, CRREM delivers a science-based, methodically rigorous, industry-supported, and framework-aligned way for the commercial real estate sector to understand international contexts, set science-based targets, benchmark specific real assets, and analyse portfolio performance. Energy reduction and GHG intensity play a crucial role in transitional risk. The GHG intensity can be measured by the CRREM. Future regulatory change on Current GHG intensity varies widely between EU countries due to their existing energy mix. As a result, there are different starting points for landlords in different countries and their future requirement to reduce GHG intensity.
From a global perspective, US residential property is well above average in terms of GHG intensity, whereas the commercial property sector is only slightly above the global average. US office buildings perform better than the global average in regard to the property GHG intensity.
France stands out with a very low current GHG intensity mainly due to its reliance on nuclear energy which represents 70% of the energy produced. This also leaves it with a not very steep GHG reduction pathway. Italy, Spain and CEE have much more to do in this respect due to a low percentage of renewable energy in their current energy mix. In the residential and commercial sectors, countries such as Brazil, New Zealand and Canada are the best performers, while Australia, Hong Kong and Singapore tend to be at the bottom of the league in the national comparison.
GHG intensity varies also by property type, with hotels, healthcare and office among the most intensive sectors and residential and logistics among the least intensive sectors. Based on our analysis, investors across global real estate are not (yet) pricing in climate change. •
Do you disagree with the author’s conclusion? Have a different opinion or point of view? Please share your thoughts with REI, or better yet prepare and submit a manuscript for publication by emailing the Real Estate Issues Executive Editor (or Board) on this article to rei@cre.org.
Endnotes
1. United Nations Framework Convention on Climate Change (UNFCCC) – UN-FCCC (2015): “Report of the Conference of the Parties on its twenty-first session, held in Paris from 30 November to 13 December 2015. Addendum. Part 2: Action taken by the Conference of the Parties at its twenty-first session.” https://unfccc.int/sites/default/files/english_paris_agreement.pdf ↩
2. Task Force on Climate-Related Financial Disclosures (2019): 2019 Status Report. Online: https://www.fsb-tcfd.org//www/wp-content/uploads/2019/06/2019-TCFD-Status-Report-FINAL-053119.pdf ↩
3. CRREM, Carbon Risk Real Estate Monitor (2020), “CRREM Global Pathways”, Summary of Pathways, available at https://www.crrem.org/pathways. ↩
4. CRREM, Carbon Risk Real Estate Monitor (2020), “From Global Emission Budgets to Decarbonisation Pathways at Property Level: CRREM Downscaling and Carbon Performance Assessment Methodology”, available at: https://www.crrem.org/pathways. ↩
5. Brounen, D., Groh, A., (2020) The Value Effects of Green Retrofits. Journal of European Real Estate Research. ↩
6. EU Sustainable Action Plan (2018): “Action Plan: Financing Sustainable Growth” European Commission, Brussels 2018. Online: https://eur-lex.europa.eu/legal-content/EN/TXT/HTML/?uri=CELEX:52018DC0097&from=EN ↩
7. EU Technical Expert Group on Sustainable Finance (2020): Taxonomy: Final report of the Technical Expert Group on Sustainable Finance. Online: https://ec.europa.eu/info/sites/info/files/business_economy_euro/banking_and_finance/documents/200309-sustainable-finance-teg-final-report-taxonomy_en.pdf ↩