Volume 38, Number 3
Published: Winter 2013
By James E. Larsen, Ph.D.; M. Fall Ainina, Ph.D.; Marlena L. Akhbari, Ph.D.; Nicolas Gressis, Ph.D., and Carol Wang, Ph.D.

Introduction
This article investigates whether real estate investment trust (REIT) investors might be able to enhance their return by pursuing investment timing strategies that have been demonstrated to be successful in the broad stock market. Two such strategies are the price momentum strategy, which posits that investors can profit by investing in shares that have recently risen in price because that trend will tend to persist, and the price contrarian strategy, which suggests investors can profit by assuming positions to capture security price trend reversals. Only a handful of studies, however, have applied either of these strategies to REITs exclusively. Most of these more focused studies investigate time periods that predate the modern REIT era, and none has directly compared the effectiveness of these competing strategies as a REIT investment timing mechanism. Another widely known investment strategy, “Dogs of the Dow,” which suggests that superior share price performance will occur for firms with the highest dividend-to-share-price ratio, has not, to date, been tested using REITs. The purpose of the study presented in this article, therefore, is to investigate the effectiveness of each of these strategies over a more recent time period to determine which would have been most profitable for REIT investors. Each strategy is used to formulate a series of equally-weighted, non-overlapping portfolios held for a variety of holding periods (ranging from two to 52 weeks) over the 11-year study period (December 1999–March 2011).
In testing another investment timing strategy (i.e., that portfolios of low [high] price-to-earnings stocks outperform [underperform] the stock market), Anderson and Brooks1 found that returns are enhanced if portfolios are restricted to the shares of relatively few firms from the tails of the price-to-earnings distribution. To determine if their findings apply to the strategies investigated here, the number of firms in each portfolio is restricted; ranging from 30 to five REITs. Only one of the strategies, the Dogs of the Dow, provided returns that were inversely related to the number of REITs in the portfolio, and when the number of REITs in the portfolio was limited to five, the Dogs of the Dow dominated the other strategies.
Literature Review
While the number of studies that have applied investment timing strategies to REITs is fairly limited, several strategies have been empirically tested. For example, in an early study which is at least indirectly related to the one presented here, Liu and Mei2 develop a model to forecast excess returns by asset class and use the forecasts to make investment decisions for several asset classes including four real estate classes: equity REITs; mortgage REITs; real estate holding companies; and real estate building companies. They used their prediction each month between February 1981 and December 1989 to either invest in (or continue to hold) all firms in an asset class when the forecast was positive, or liquidate their investment in an asset class and move the money to Treasury bills when the forecast was negative (in a second iteration, asset classes with a negative forecast were shorted). Of particular interest to the study presented here, the total cumulative return for equity REITs was 97 percent, which exceeded the buy-and-hold strategy return of 50.9 percent and 51.2 percent for equity REITs and the S&P 500, respectively.
A price momentum trading strategy prescribes that investors initially form a portfolio by purchasing stocks that recently have generated the highest returns (winners) and shorting those with the lowest returns (losers). The strategy is based, in part, upon the assumption that winners will continue to generate high positive returns and losers will continue to generate high negative returns. But momentum can wear out, so the strategy also requires that the portfolio be periodically reformulated, again populated with the most recent winners and losers. Studies by Jegadeesh and Titman3, Hong, Lim and Stein4 and others have documented that momentum strategies work well in the broad stock market when implemented over a large number of diverse stocks. In studies applying a price momentum strategy to a particular industry rather than to the broader market, results have been mixed. Moskowitz and Grinblatt5, for example, found that the strategy did not work well when restricted to a particular industry. Three studies, however, have documented significant momentum returns in REITS.
Chui, Titman and Wei6 analyzed momentum portfolios formed from all publicly traded (equity, mortgage and hybrid) REITs traded on the NYSE, AMEX and NASDAQ from February 1983 to June 1999. Value-weighted portfolios were formed each month based on the REIT’s most recent six-month return. Any REIT whose return was in the top 30 percent of all REIT returns was purchased and those in the bottom 30 percent were sold short. They did not find a momentum effect in REITs in the pre-1990 period, but found a strong and prevalent momentum effect after 1990. As explained in the next section, 1990 may not have been the best demarcation point for their study.
Hung and Glascock7 analyzed momentum portfolios formed from all publicly traded (equity, mortgage and hybrid) REITs traded on the NYSE, AMEX and NASDAQ with at least three years of monthly returns in Center for Research in Security Prices (CRSP®) from July 1983 to December 2006. Portfolios were formed each month and held for six months. When the requirement for a REIT to qualify for portfolio inclusion was that the most recent monthly return be in the top 30 percent of all REITs, the mean (equal-weighted) return for the long, overlapping portfolios was 1.71 percent. When the requirement for portfolio inclusion was tightened to the top 10 percent, the mean (equal-weighted) long portfolio return was 2.06 percent. Both of these were significant at the five percent level.8 Using basically the same data and portfolio formation methodology, Hung and Glascock9 report similar findings for momentum portfolios based on monthly returns during the time period of January 1972 to December 2000. In their study, momentum returns were regressed against a variety of variables, and it was determined that momentum returns are higher in up markets and, of particular interest to the study we present, that REIT winner portfolios have higher dividend-to-price ratios. This suggests that the Dogs of the Dow strategy might be a profitable way to formulate REIT portfolios. A search of the literature, however, uncovered no published studies to date that have tested this possibility.
Contrarian investment strategies essentially propose investing in securities on which other investors have turned their backs. Among the first to discover the potential for excess returns in contrarian investing were De Bondt and Thaler.10 In their study, they examined the cumulative average residuals of winner portfolios (consisting of stocks with recent percentage price increases) and loser portfolios (consisting of stocks with recent percentage price decreases). They formed a series of non-overlapping portfolios consisting of either extreme losers or extreme winners from January 1933 to December 1980. The three-year return on their loser portfolios outperformed the market, on average, by 19.6 percent, while winner portfolios underperformed the market by about five percent.11
Conflicting results were obtained in two studies which applied price contrarian strategies to REITs. The first was conducted by Mei and Gao,12 who formed portfolios consisting of equity REITs, mortgage REITs, real estate holding companies, and building companies between July 2, 1962 and December 31, 1990. Firms with low weekly returns were purchased and firms with high weekly returns were shorted. They reported that the returns their constructed portfolios generated were modestly profitable, but not enough to cover transactions costs. Cooper, Downs and Patterson13 subjected all publicly traded REITs in the CRSP file between 1973 and 1995 to a contrarian strategy, and report significant weekly returns. The performance of each REIT during the previous week was calculated and then, in separate iterations, any REIT whose shares had decreased (increased) in price during the past week by either 0–2%, 2–4%, 4–6%, 6–8%, 8–10%, or by more than ten percent was purchased (shorted). Their results indicate that the higher the return filter, the greater were the realized weekly returns. The more stringent the filter, however, the fewer the number of weeks in which a portfolio could be formed. For example, the ten percent filter resulted in long portfolios being formed in only 477 of the 1,294 weeks in the study. The average annual return for all long portfolios ranged from 11.33 percent to 58.12 percent, and (except for the portfolio based on the zero-to-two percent filter) exceeded the average annual return of 13.1 percent associated with a strategy of buying and holding all REITs over the study period. None of the annual returns for the short portfolios exceeded 13.1 percent.
One characteristic that all of the above-mentioned REIT studies have in common is that their study periods, either in whole or in large part, predate the modern REIT era. Before the modern REIT era, which according to many in the industry began with the IPO of Kimco Realty Corporation in November 1991, REITs tended to be relatively small, few in number, and there existed severe restrictions on REIT managerial autonomy. The market’s interest in equity REITs, which today usually both own and manage properties, was limited, at least in part, because the ownership and management of assets were required to remain separate. Passage of the Tax Reform Act of 1986, which permitted REITs to both own and manage their properties as vertically integrated companies, helped set the stage for a secular wave of equity REIT IPOs in the 1990s. Passage of the Omnibus Budget Reconciliation Act of 1993 also was critical in increasing the number and size of equity REITS. Among other things, this Act changed the “Five or Fewer” rule which made it easier for pension plans to invest in REITs. This translated into substantial growth for the REIT market as institutional ownership of REITs soared.
The Dogs of the Dow is an example of another simple contrarian strategy. An article entitled “Study of Industrial Averages Finds Stocks with High Dividends are Big Winners,” which appeared in The Wall Street Journal,14 reported an intuitively appealing investment approach presented by John Slatter. Later dubbed the Dogs of the Dow investment strategy, Slatter suggested that investors confine their stock market selections to the 10 top yielding stocks found among the 30 industrial giants included within the Dow Jones Industrial Average (DJIA). According to Slatter, these “dogs” provide anything but dog-like returns. He offered evidence that a portfolio of high-yielding Dow stocks outperformed the DJIA by 7.59 percent.
An attractive attribute of the strategy is its simplicity. According to this strategy, the portfolio should be equally dollar weighted and consist of the common shares of the 10 firms in the DJIA with the highest dividend yield. The strategy also prescribes that the portfolio be annually reformulated to ensure it again contains an equal dollar allocation of the 10 stocks with the highest dividend yield at the time of the reformulation. Proponents of the Dogs of the Dow strategy argue that DJIA companies do not alter their dividend to reflect trading conditions and therefore, the dividend reflects the average worth of the company. Stock price, on the other hand, fluctuates through the business cycle. This should mean that firms with a high dividend relative to stock price are near the bottom of their business cycles and are more likely to see an increase in their stock prices compared to firms with a low dividend yield. Hence, an investor who is annually reinvesting in high-yield stocks should out-perform the market. The logic behind this is that a high dividend yield suggests: 1) the stock is oversold; and 2) management believes the company’s prospects are bright, and it is willing to back its belief by paying out a relatively high dividend. Investors are thereby hoping to benefit from both above-average stock price gains as well as a relatively high dividend. Additional empirical support for the Dogs of the Dow strategy has been provided by Prather,15 and by Prather and Webb,13 who both conclude that following the strategy would enable investors in the broad stock market to earn superior risk-adjusted returns. Whether a similar strategy might serve as a profitable investment strategy for REIT investors is an interesting issue that has not been empirically tested, perhaps because of the belief that there is little variation in REIT dividends. While each REIT is required to pay out at least 95 percent of (what would be) taxable income in order to qualify as a REIT and avoid federal income taxes, previous research17 documents substantial variation in REIT payout policies.
Data and Methodology
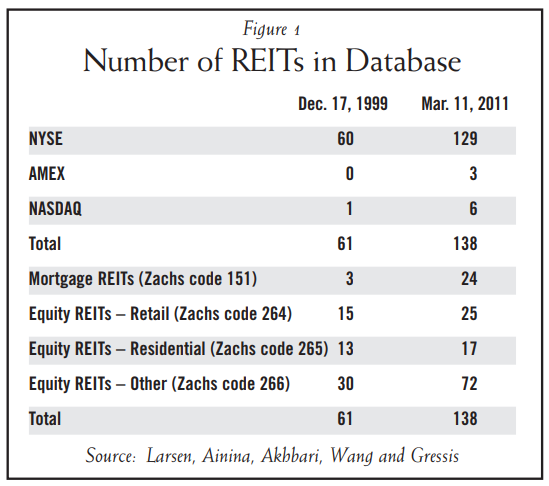
REIT share price data were obtained from Zacks Investment Research.18 Its database includes REITs listed on the NYSE, AMEX and the NASDAQ. Figure 1 reports the number of REITs listed in each exchange and the number of REITs in each of the four Zacks classifications from which the investment candidates were drawn.19 Examination of the information presented in Figure 1 reveals that almost all of the REITs in the database were listed on the NYSE and that most were classified as an equity REIT. The number of REITs in each category grew over the study period. There were 56 more equity REITs in the database at the end of the study period compared to the start, but in percentage terms, mortgage REITs in the database increased at a higher rate. They constituted less than five percent of the database at the beginning of the study period, but more than 17 percent of the database at the end of the study period.
The Zack’s Research Wizard was used to apply several preliminary screens (described in the next paragraph), create a series of non-overlapping portfolios, and to backtest the portfolios. The study period begins December 17, 1999 and continues through March 11, 2011.20 During this time period the stock market witnessed the dot-com bubble, the September 11 attacks and the sub-prime mortgage crisis. It would be safe to characterize this time period as less than stellar for the stock market in general. During the 11-year and nearly three-month study period, the S&P 500 index decreased from 1,421.05 to 1,304.28; a cumulative total negative return of 8.2 percent. An investor who bought and held REITs would have realized a substantially higher return over the same time period. The Dow Jones Equity REIT Index, for example, increased from 230.59 to 909.87; a holding period return of 294.6 percent.
Several screens were employed prior to portfolio formation. First, no ADRs or Canadian REITs were considered. Second, to help assure the trading strategies being examined could be executed in the real world, any thinly traded REIT was eliminated as a portfolio candidate. Consistent with Tziogkidis and Zachouris21 and Ainina, James and Mohan,22 any REIT with fewer than 50,000 shares traded during the 20 trading days prior to portfolio formation was eliminated from consideration. Third, because institutional investors, particularly mutual funds, are reluctant to buy stocks whose prices have fallen below five dollars, any REIT with a share price less than five dollars at the time of portfolio formation was also eliminated. Other researchers, including Cooper, Downs and Patterson noted above, suggest that another benefit of this last screen is that it reduces bid-ask bounce effects.
The following methodology was employed to test each investment strategy. The first of the two-week price momentum portfolios was formed on December 17, 1999 by identifying and combining into equal dollar weighted portfolios the (in separate iterations) five, 10, 20 and 30 REITS with the largest percentage price increase during the previous two weeks. A long position was assumed in each portfolio and, at the end of two weeks, the portfolio return was calculated and a new portfolio formed, which could include REITs contained in the previous portfolio. This process continued bi-weekly though March 11, 2011. A similar process was used to form the non-overlapping four-week, 12-week, 24-week and 52-week price momentum portfolios, but with the holding periods now equal to four, 12, 24, and 52 weeks, respectively, and the selection criterion equal to the REITs with the largest four-week, 12-week, 24-week and 52-week percentage price increase. The same process was repeated to form portfolios based upon the price contrarian and Dogs of the Dow strategies, where the selection criterion was, respectively, the REITs with the largest percentage price decrease, and the REITs with the highest dividend-to-share-price ratio.
Next, we incorporate transactions cost into the return data. Many recent studies have relied upon estimates of transaction cost data presented in Keim and Madhavan.23 Their estimates include commissions paid by institutional investors as well as an estimate of the price impact of the trade. Several researchers using the Kiem and Madhavan (KM) estimates, including Avramov et al.,24 conclude that abnormal pre-transaction cost returns associated with trading strategies, similar to those investigated here, disappear once transaction costs are considered. However, de Groot et al.25 point out that the KM estimates (which were developed using transactions from January 1991 through March 1993) may be overstated for more recent time periods because of important market changes (e.g., increased trading volume, more competition among brokers, technological improvements, and the move to decimal pricing in 2001 all contributing to a large decrease in bid-ask spreads). Using more recent transaction cost data which de Groot et al. obtained from one of the world’s largest brokerage houses, they estimate that the average one-way commission on institutional trades during the past 10 years of their study period, 2000–2009, was three basis points.
The rebalancing needed in our study to equally weight each portfolio at each reformation will require a trade for each REIT in the portfolio at each reformation (except in the unlikely event that the REITs already in the portfolio still constitute the best portfolio and that the relative value of each REIT in the portfolio has not changed since the previous reformation). For individual investors, transaction costs are obviously positively related to the number of portfolio reformations, but the (low) fixed-dollar commissions available through discount brokers over the study period means the exact percentage commission that applies to each portfolio is dependent on the dollar value of each transaction. It is assumed that our trades are small enough so that the price impact of each trade is effectively zero, and following de Groot et al., that trading costs are equal three basis points for each REIT in each portfolio for both the initial and last trade, and six basis points for each REIT in each portfolio when reformation occurs. For example, reformation of a five REIT portfolio would incur commissions equal to 30 basis points while reformation of a 30 REIT portfolio would involve 180 basis points.
Finally, to investigate the risk/reward relationship associated with each portfolio, the information ratio is calculated.26 We follow a well-established precedent and use the S&P 500 as the benchmark, and in each case we match the holding period and reforming frequency of the benchmark returns with those used to form the subject portfolio. The information ratio is often used to gauge the skill of investment fund managers because it measures the active portfolio return adjusted for the amount of risk that the manager takes relative to the benchmark. Grinold and Kahn27 report that top-quartile investment fund managers typically achieve information ratios of approximately 0.5. The information ratio (IR) is equal to:
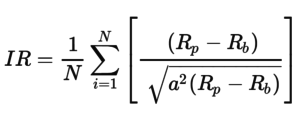
where Rp is the portfolio return, Rb is the benchmark return, and the reward is defined as the average difference between the returns of the portfolio and the benchmark (the tracking error), standardized by risk (the standard deviation of the tracking error).
Results
Examination of the cumulative returns shown in Figure 2 reveals that each of the 60 portfolios provided a handsome pre-transaction cost return compared to any broad market measure. For example, the S&P bi-weekly, monthly, quarterly, semi-annual and annual total compounded return for the study period was 9.9 percent, 10.4 percent, 10.2 percent, 5.3 percent and 0.2 percent respectively. Only 27 of the portfolios, however, outperformed the previously mentioned buy-and-hold cumulative return of 294.6 percent for the Dow Jones Equity REIT Index.
In Figure 2, the cumulative return for the strategy with the highest return for each combination of holding period and portfolio size is shown in bold italics. Of the 20 combinations of holding period and portfolio size tested, the Dogs of the Dow provided the highest return in nine cases, while the price momentum and price contrarian generated the top return in seven and four cases, respectively. The strategy that provided the highest pre-transaction cost return of any combination (774.6 percent) was the Dogs of the Dow, where the portfolio consisted of only five REITs and was reformed every two weeks.
Focusing on the influence of the frequency of portfolio rebalancing, the following observations can be made. Considering all portfolio sizes tested, if the portfolios are held for a relatively long period such as quarterly or semiannually, momentum returns are higher, on average, than those of both the contrarian and the Dow strategy. However, momentum returns become smaller if the portfolios are rebalanced more frequently such as biweekly or monthly. In contrast, the price contrarian returns are positively related to the length of the holding period, and the Dogs of the Dow returns show a slight declining trend as the holding period increases. However, compared to the other two strategies, the Dogs of the Dow appears to produce relatively stable performance across different holding periods, suggesting that the Dogs of the Dow strategy is not as sensitive to the frequency of rebalancing as are the other two strategies. The performance of the Dogs of the Dow portfolios was particularly strong given either a two-week or annual holding period.
Switching the focus to portfolio returns as a function of portfolio size, it can be observed in Figure 2 that no strategy consistently provided the highest return for portfolios consisting of 10, 20 or 30 REITs. However, with portfolios limited to five REITs the Dogs of the Dow strategy generated a higher pre-transaction cost return than any other strategy for each holding period. Note that as the size of the portfolios grows, the effectiveness of the Dogs of the Dow strategy dissipates, suggesting that the Dogs’ effect concentrates on the extreme case. An issue of particular interest in the our study was whether any of the strategies tested would provide results consistent with those reported by Anderson and Brooks28 which suggest that portfolio performance may be enhanced by restricting the portfolio to those REITs with extreme values of the critical variable for each strategy. The Dogs of the Dow strategy was the only one that provided returns consistent with this suggestion. These results suggest that REIT investors looking to maximize their returns, when pursuing the Dogs of the Dow strategy, should restrict their investments to REITs in the extreme tail of the dividend-to-price ratio distribution. REIT investors applying either of the other two strategies, however, where performance tended to be positively related to the number of REITs in the portfolio, would benefit by including more REITs.
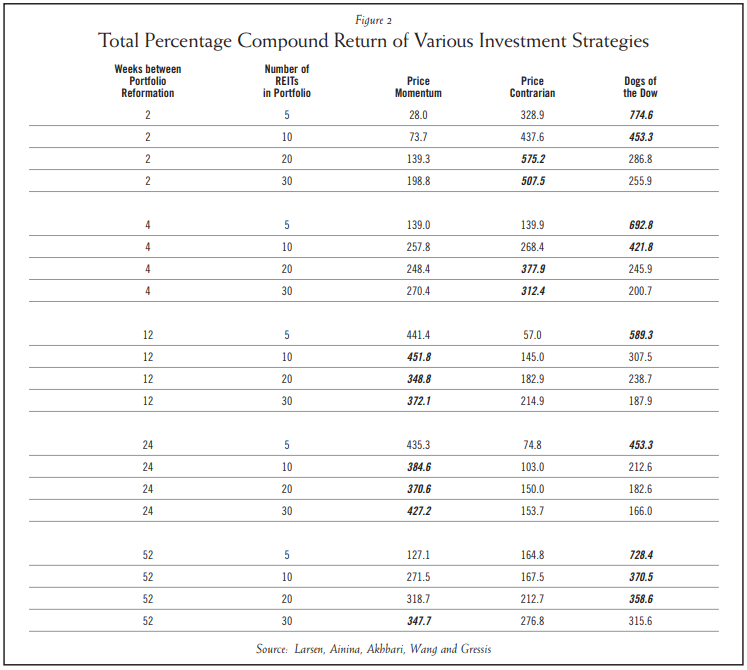
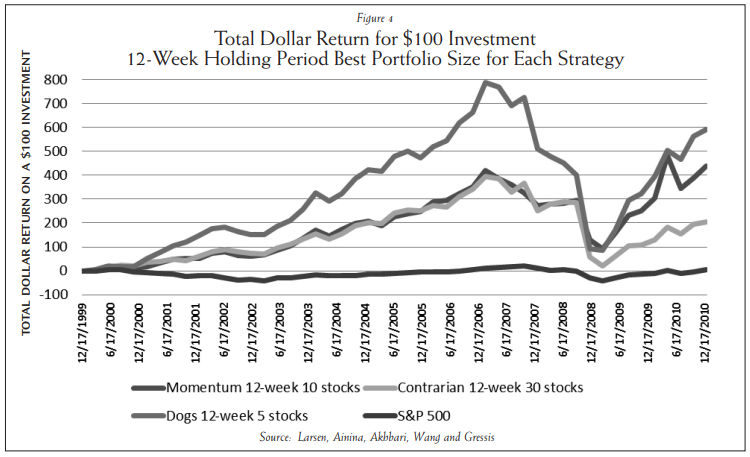
Figures 3 and 4 provide evidence that the positive portfolio performance was fairly consistent over the study period with a notable exception. All of the portfolios lost value for approximately 18 months, beginning at about the same time as the sub-prime mortgage crisis.29 Figure 3 presents a comparison of total dollar returns for all three strategies along with the S&P 500 for the entire study period for portfolios that were formulated every 12 weeks and consisted of five REITs. The performance of the other holding periods and portfolio sizes (not shown here for space economy) depict similar patterns of total dollar returns.
Figure 4 takes a slightly different perspective and presents a comparison of the total dollar returns based again on 12-week holding periods, but in this case the results shown in the figure are for the portfolio size that produced the best results for each strategy. For the Dogs of the Dow strategy, the five REIT portfolio produced the largest return; for the contrarian portfolio, the 30 REIT portfolio produced the strongest performance; and for the momentum strategy, the best-performing portfolio was the 10 REIT portfolio. In both figures 3 and 4, the five REIT Dogs of the Dow portfolio outperforms the others often by a wide margin in all periods except a brief period near the end of 2008, at which point it was outperformed by the momentum strategy.
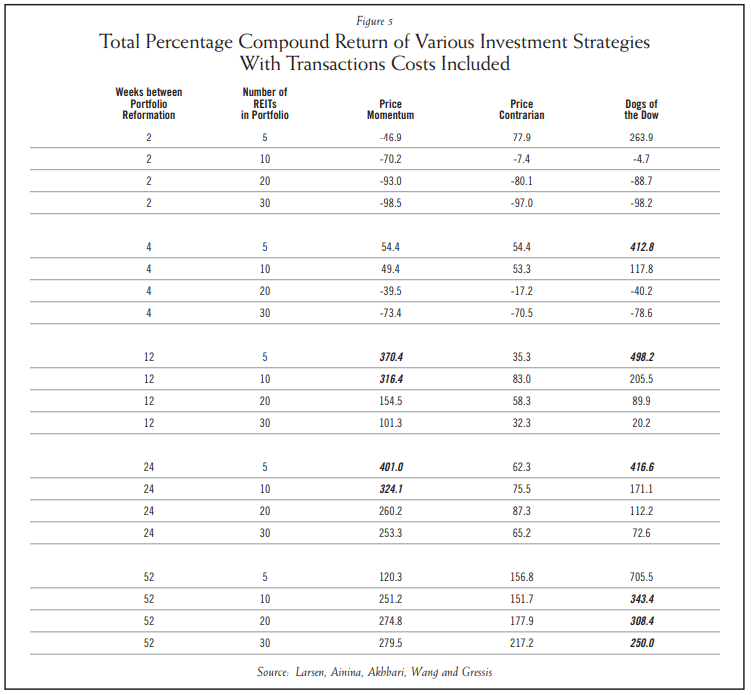
Comparison of the returns shown in Figure 5 and Figure 2 reveals the impact of transactions costs is substantial for portfolios that were formulated every two, four and 12 weeks. The return on all but one of the two-week portfolios turns negative once transaction costs are incorporated, and the only portfolio with a positive return (five REIT, two-week, Dogs of the Dow) returned less than could have been earned during the same time period by buying and holding the Dow Jones Equity REIT Index (DJREIT). Further, note that only 10 portfolios (shown in Figure 5 in bold italics) generated a post-transaction cost return that exceeded what could have been earned following a DJREIT buy-and-hold strategy, that the highest return for each holding period was achieved by the Dogs of the Dow strategy, and that no price contrarian portfolio beat the DJREIT. The returns reported here would be less impressive if they were achieved by assuming inordinate risk. Comparison of the returns in Figure 2 with the information ratios for each portfolio in Figure 6 demonstrates that, in fact, in all but two (of the 20) cases, the strategy with the highest return for a particular holding period also had the best risk return profile (the highest information ratio) for that holding period; the exceptions being the portfolios for the five REIT/24-week holding period and the 20 REIT/52-week holding period.
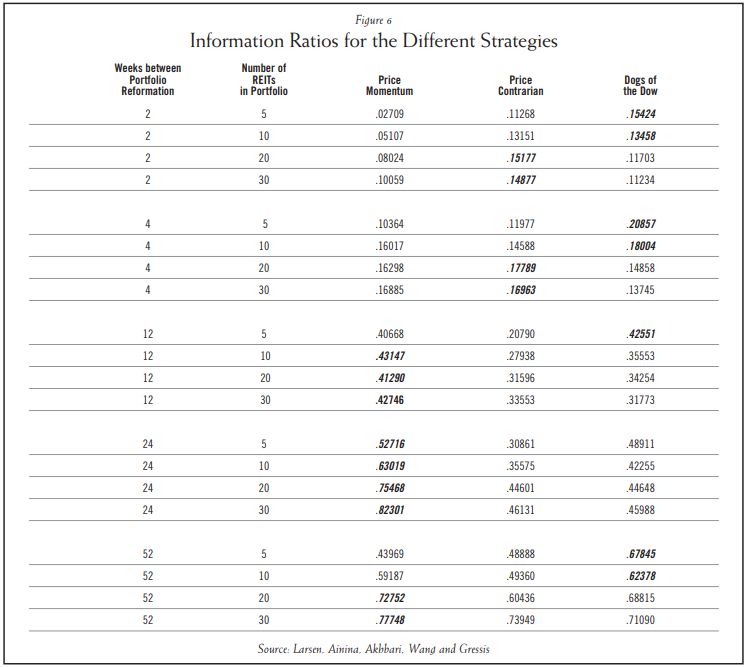
Several additional points are worth noting. First, note that, regardless of the timing strategy being tested, the value of the information ratio and the length of the holding period are positively related. This relationship is consistent with the observation of Grinold and Kahn30 that the value of the Information Ratio depends on the time horizon; increasing with the square root of time. In the case we present, for all three strategies, the risk-adjusted returns improve as the time horizon increases, with the momentum strategy demonstrating the most noticeable growth. Second, for both the price momentum and price contrarian strategies, the greater the number of REITs in the portfolio, the stronger the risk-adjusted performance. In general, rebalancing less frequently and holding more REITs in the portfolio contribute to a higher risk-adjusted return under both momentum and contrarian strategies. Third, just as it was for the raw returns, the risk-adjusted returns of the Dogs of the Dow strategy are inversely related to portfolio size. Finally, the information ratios shown in Figure 6 for portfolios reformulated annually compare favorably to the (approximately) .5 annual performance information ratios reported by Grinold and Kahn for top-quartile investment fund managers.
Summary
This study is the first to extend the Dogs of the Dow strategy to REITs, and the first to directly compare the price momentum, price contrarian and Dogs of the Dow strategies for REIT investment timing effectiveness. It provides empirical evidence of the predictive power of the Dogs of the Dow strategy in the market for REIT shares between December 1999 and March 2003. The degree to which the timing strategies examined here will enable current and future investors to formulate REIT portfolios that outperform a buy-and-hold strategy cannot be guaranteed, but the results do provide REIT investors with something to consider in developing new trading rules that can capture the strengths of the various strategies.31
Each strategy provided impressive pre-transaction cost returns. The worst-performing portfolio generated a cumulative return of 28 percent during the same time period in which the S&P 500 generated a negative return of 8.2 percent. One dollar invested at the beginning of the study period in the best-performing portfolio would have been worth $7.75 at the end of the study. One way to achieve a high return is to assume high risk, but in this study the best performing portfolios also tended to have the best information ratios, indicating that superior performance was not the result of extreme risk assumption. However, only 10 portfolios generated a post-transaction cost return that exceeded what could have been earned by buying and holding the Dow Jones Equity REIT Index.
This study explores various versions of the three competing strategies in terms of the number of portfolio components and rebalancing frequency. With regard to rebalancing frequency, none of the strategies consistently generated higher returns than the others. With one exception, the same result is applicable regarding portfolio size. When portfolio size was limited to five REITs, the Dogs of the Dow strategy provided the highest return for every holding period examined. An issue of particular interest was the relationship between returns and portfolio size. There was a negative relationship for Dogs of the Dow portfolios, a positive relationship for price contrarian portfolios, and none for the price momentum strategy. This indicates that restricting a portfolio to relatively few REITs in the tail of the dividend-to-price ratio distribution may prove beneficial for REIT investors pursuing a Dogs strategy, but a similar restriction may reduce returns for REIT investors pursuing a price contrarian strategy.
Endnotes
1. Anderson, K. and C. Brooks, “Extreme Returns from Extreme Value Stocks: Enhancing the Value Premium,” Journal of Investing, Vol. 16, No. 1, 2007, pp. 69–81. ↩
2. Liu C. and J. Mei, “An Analysis of Real Estate Risk Using the Present Value Model,” Journal of Real Estate Finance and Economics, Vol. 8, No. 1, 1994, pp. 5–20. ↩
3. Jegadeesh, N. and S. Titman, “Returns to Buying Winners and Selling Losers: Implications for Stock Market Efficiency,” Journal of Finance, Vol. 48, No. 1, 1993, pp. 65-91; and “Profitability of Momentum Strategies: An Evaluation of Alternative Explanations,” Journal of Finance, Vol. 56, No. 2, 2001, pp. 699–720. ↩
4. Hong, H., T. Lim and J. Stein, “Bad News Travels Slowly: Size, Analyst Coverage and the Profitability of Momentum Strategies,” Journal of Finance, Vol. 55, No. 1, 2000, pp. 265–295. ↩
5. Moskowitz, T. J. and M. Grinblatt, “Do Industries Explain Momentum?” Journal of Finance, Vol. 54, No. 4, 1999, pp. 1249–1290. ↩
6. Chui, A.C.W., S. Titman and K.C.J. Wei, “Intra-industry Momentum: The Case of REITs,” Journal of Financial Markets, Vol. 6, No. 3, 2003, pp. 363–387. ↩
7. Hung, S. K. and J. L. Glascock, “Volatilities and Momentum Returns in Real Estate Investment Trusts,” Journal of Real Estate Finance and Economics, Vol. 41, No. 2, 2010, pp. 126–149. ↩
8. With the 30 percent filter, Glascock and Hung’s mean short portfolio return was insignificant, and with the 10 percent filter, the mean short portfolio return was significant at the five percent level, but amounted to only 0.01 percent. This is typical for all of the REIT studies on topic; i.e., researchers who formed the classic costless portfolios routinely reported that nearly all of their total returns were generated by the long, rather than the short, portfolio. ↩
9. Hung, S. K. and J. L. Glascock, “Momentum Profitability and Market Trend: Evidence from REITs,” Journal of Real Estate Finance and Economics, Vol. 37, No.1, 2008, pp. 51–69. ↩
10. De Bondt, W.F.M. and R. Thaler, “Does the Stock Market Overreact?” Journal of Finance, Vol. 40, No. 3, 1985, pp. 793–805. ↩
11. Other researchers have demonstrated the success of alternative contrarian strategies based on buying(selling) stocks that are priced low(high) relative to various accounting measures of performance, including: earnings-to-price ratio, cash flow-to-price ratio and book value-to-price ratio, as well as strategies based on low/high measures of earnings per share growth. These strategies are beyond the scope of the present paper. ↩
12. Mei, J. and B. Gao, “Price Reversal, Transaction Costs, and Arbitrage Profits in Real Estate Securities Markets,” Journal of Real Estate Finance and Economics, Vol. 11, No. 2, 1995, pp. 153–165. ↩
13. Cooper, M., D.H. Downs and G.A. Patterson, “Real Estate Securities and a Filter-based, Short-term Trading Strategy,” Journal of Real Estate Research, Vol. 18, No. 2, 1999, pp. 313–333. ↩
14. Dorfman, J.R., “Study of Industrial Averages finds Stocks with High Dividends are Big Winners,” The Wall Street Journal, p. C2, Aug. 11, 1988. ↩
15. Prather, L.J., “An Empirical Test of the Dow Dividend Theory,” The Southern Business and Economic Journal, Vol. 23, No. 3, 2000, pp. 170–184. ↩
16. Prather, L.J. and G.L. Webb, “Window Dressing, Data Mining, Or Data Errors: A Re-Examination Of The Dogs Of The Dow Theory,” Journal of Applied Business Research, Vol. 18, Issue 2, 2002, pp. 115–124. ↩
17. Includes these studies: Wang, K., J. Erickson and G. Gau, “Dividend Policies and Dividend Announcements for REITs,” American Real Estate and Urban Economics Association Journal, Vol. 21, No. 2, 1993, pp. 185–201; M. Bradley, D.R. Capozza and P. Seguin, “Dividend Policy and Cash Flow Uncertainty,” Real Estate Economics, Vol. 26, No. 4, 1998, pp. 555–580; and J. G. Kallberg, C. H. Liu and A. Srinivasan, “Dividend Pricing and REITs,” Real Estate Economics, Vol. 31, No. 3, 2003, pp. 435–50. ↩
18. Although relatively new, the Zacks database is growing in popularity with researchers. Notable papers that have used this resource include B. Barber, R. Lehavy, M. McNichols and B. Trueman, “Can Investors Profit from the Prophets? Security Analyst Recommendations and Stock Returns,” Journal of Finance, Vol. 56, No. 2, 2001, pp. 531–563; also Tziogkidis and Zachouris (see endnote 21), and Ainina, James and Mohan (see endnote 22). ↩
19. Three companies (ticker symbols: EQKR, HBOI and NLP) listed as REITs in the Zacks database were eliminated from consideration because a review of the company descriptions in Bloomberg indicated none of the three was a REIT, and none was a member of NAREIT as of the end of the study period. ↩
20. The study period begins with the first date Zachs data was available and ends with the last available data when our analysis commenced. ↩
21. Tziogkidis, P. and P. Zachouris, “Momentum Equity Strategies: Are Certain Firm-Specific Variables Crucial in Achieving Superior Performance in Short Term Holding Periods?” International Research Journal of Finance and Economics, Vol. 24, 2009, pp. 7–27. ↩
22. Ainina, M.F., D. James and N. Mohan, “Investment Opportunities in Zombie Stocks,” Financial Decisions, Winter 2010, pp. 1–15. ↩
23. Keim, D.B. and A. Madhavan, “Transaction Costs and Investment Style: An Interexchange Analysis of Institutional Equity Trades,” Journal of Financial Economics, Vol. 46, No. 3, 1997, pp. 265–292. ↩
24. Avramov, D., T. Chordia and A. Goyal, “Liquidity and Autocorrelation in Individual Stock Returns,” Journal of Finance, Vol. 61, No. 5, 2006, pp. 2365–2394. ↩
25. de Groot, W., J. Huij and W. Zhou, “Another Look at Trading Costs and Short-term Reversal Profits,” Journal of Banking & Finance, Vol. 36, No. 2, 2012, pp. 371–382. ↩
26. The information ratio is similar to the Sharpe ratio in that both are risk-adjusted performance measures that measure excess return per unit of risk. The primary difference between the two is that the Sharpe ratio measures excess return relative to the risk-free rate while the information ratio measures how much the subject portfolio performed relative to a specific benchmark. ↩
27. Grinold, R.C. and R.N. Kahn, Active Portfolio Management: A Quantitative Approach for Providing Superior Returns and Controlling Risk, New York, N.Y., McGraw-Hill, 2000. ↩
28. Op. cit. at 1. ↩
29. Although the exact start of the sub-prime crisis is difficult to pinpoint, some experts suggest it began in June 2007 when two Bear Stearns hedge funds collapsed. The interested reader can learn more at: http://www.foreclosuredataonline.com/blog/foreclosurecrisis/the-subprime-mortgage-crisis-how-did-it-all-start/. ↩
30. Op. cit. at 27. ↩
31. The share price performance of REITs has been less impressive compared to the S&P 500 since the conclusion of our study period. From March 2011 through October 2013 the total return of the Dow Jones Equity REIT Index was 33.2 percent compared to 41.8 percent for the S&P. If this relationship were to continue it could affect the riskiness of REIT portfolios (as measured by the information ratio), but it would not necessarily influence the ability of the various strategies to formulate portfolios that outperform a buy-and-hold strategy. ↩
Other Resources
Chan, L. and J. Lakonishok, “Value and Growth Investing: Review and Update,” Financial Analysts Journal, Vol. 60, No.1, 2004, pp. 71–86.
Mei, J. and C. Liu, “The Predictability of Real Estate and Market Timing,” Journal of Real Estate Finance and Economics, Vol. 8, No. 2, 1994, pp. 115–135.