Introduction: Downsizing Space per Worker is a Cost Savings Goal
A corporate real estate manager today might say the space target for his/her firm is 150 square feet per worker or even much less. The Government Services Administration (GSA) seems to be aiming for much lower figures and even encouraging telecommuting.[1] Who is downsizing and how fast are they downsizing in the office market? Will less office space be needed? These questions are discussed below.
The typical firm in the United States occupies about half its capacity of space at any point in time, known as capacity utilization. If this figure could be improved, the thought is that occupants could save money. One way to increase the utilization rate is to embrace shared standardized space not dedicated by rank and not dedicated to specific employees, using shared digital cloud-style storage systems. However, low space targets per worker are only possible when the firm is able to match its leased space with a predictable number of employees spending a predictable amount of time in the office. Firms that are growing or shrinking or experiencing significant turnover struggle with matching fixed leased space with current needs. A second method to decrease space per worker is simply to allocate less space. We already witness much lower office space per person figures in Asia and the more expensive European markets, but one might argue that culture deters U.S. markets from squeezing workers together too closely. For example, based on the experience of the author, Americans speak louder on average than the French or the Chinese or Japanese, whether in the office or a restaurant, and this impedes the ability to pack workers too closely, as the noise level from side conversations can be a problem.
For forecasting future office demand, the estimate of office-using employment is no more or less critical an assumption than the space required per worker, and at the same time, the disparity of assumptions on space per worker that we observe in the market is baffling. More refined office demand models will use space per worker by industry sector, with a forecast of the growth by each sector for each geographic market. Often the space planning decisions boil down to a reasonable guess on the space requirement per worker and how important it is for everyone to have space.[2] One minor but significant reason discrepancies occur in the amount of space assumed to be required per person is the differing terminology generated and used in the worlds of space managers and asset managers. However, this explains only approximately 16 percent of the difference. International Facility Managers Association focuses on useable space while NAIOP[3] and the commercial real estate industry generally focus on rentable building area (RBA). RBA averages 16 percent more than useable space.
Space Per Worker Trends
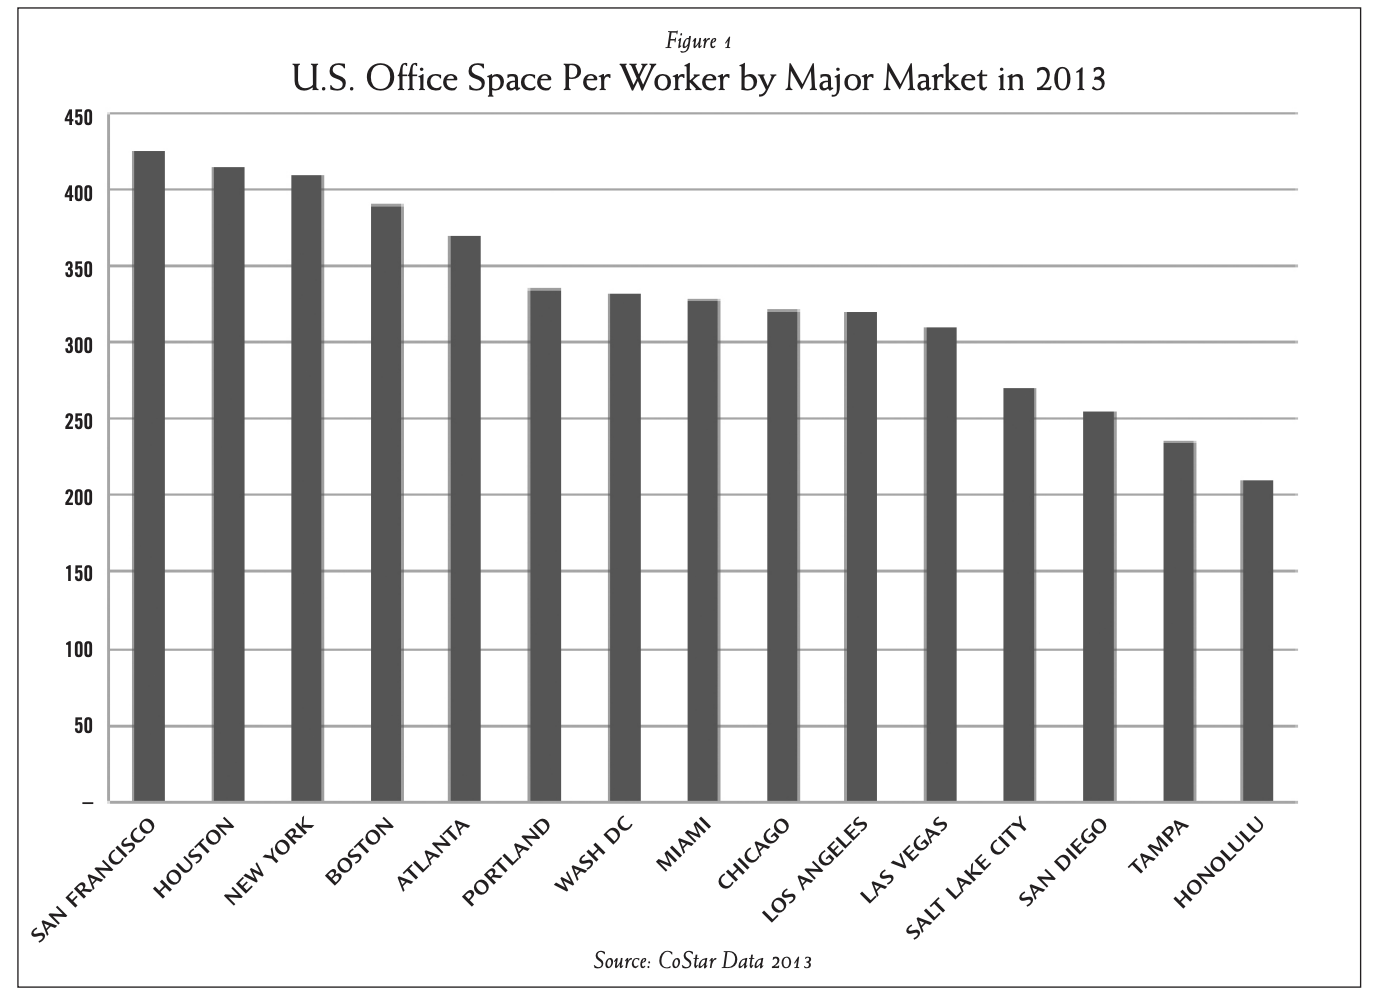
Looking only at the square footage per worker on new leases in the U.S. market, where the tenant moved in within the last 90 days, a downward trend can be observed. In September 2013 the most recent office leases averaged only 180 square feet per person while the same calculation for all leases is in excess of 300 square feet per person.[4] One would expect that space per worker would be less in the most expensive cities, but in the U.S. this is not the case. New York City, San Francisco and Boston use more space per worker while Columbus, Ohio and Tampa, Florida use less. Analysts at Property Portfolio Research have suggested this is because of the high-end wages paid to professionals in the first three abovementioned markets. Back office workers are placed in less expensive locations. Perhaps this is true, but we do not see an inverse correlation of space per worker and rental rates. Another possible reason is simply data misclassification. In the CoStar database, a building that is primarily used for office is classified as 100 percent office, even though some space on the lowest and highest floors may be used as retail space or for restaurants. This is especially true in dense cities like New York, and thus the data may make the larger, expensive cities appear to have more space per person than they actually do.
Figure 1 shows the office space per worker for selected cities:
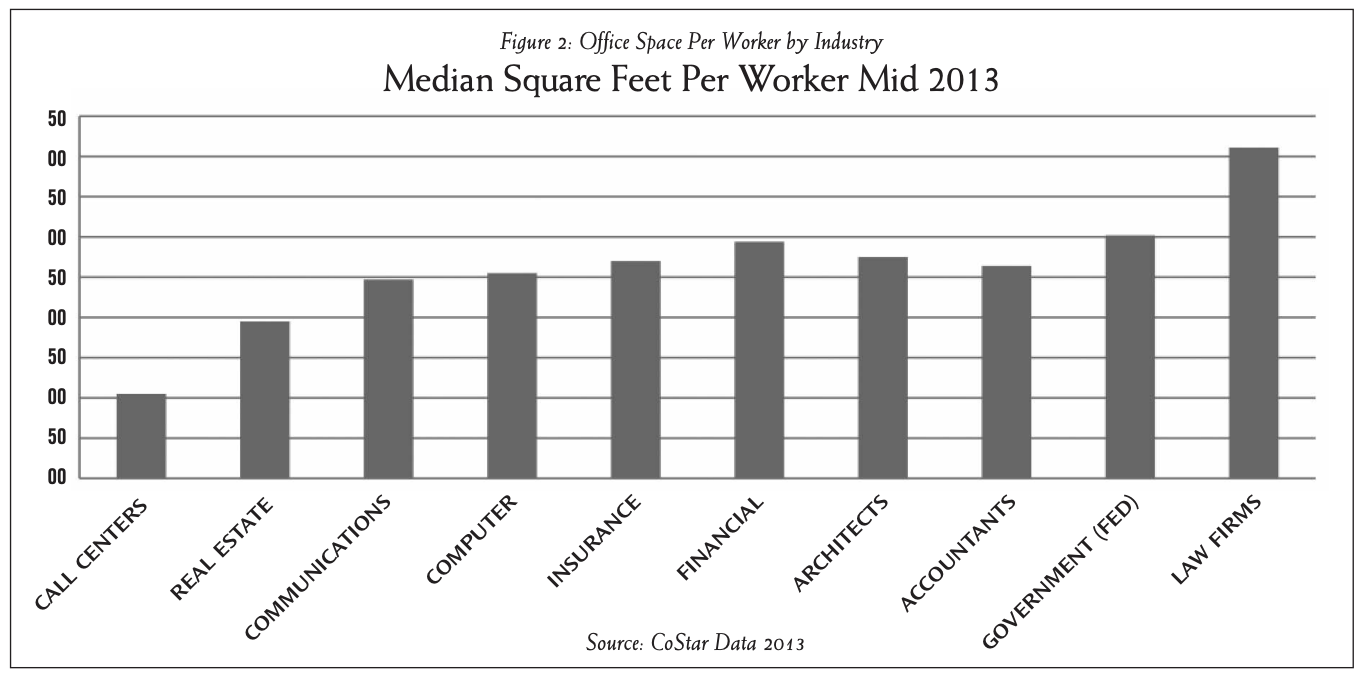
Huge differences in space per worker by industry should not be surprising. Figure 2 shows the typical spread among industry sectors. Not shown is the fact that leased space has been shrinking. Average footprints have shrunk by 24 percent from 2003 to 2013. The federal government figures are likely to shrink the most over the next several years because of Congressional mandates to the GSA to reduce occupancy costs and shrink overhead. This mandate already is starting to affect the Washington D.C. market.
Who is Downsizing?
In a 2011 survey by the author using help from CoreNet Global and CBRE Group, resulting in a sample of 78 CoreNet members and 212 CBRE tenants, it was clear that the group of CoreNet members was much larger by employee count, often using more than 50,000 square feet, while the group of CBRE tenants was much smaller, averaging less than 10,000 square feet. The contrast in their answers was clear. The larger groups of tenants were trying to increase utilization rates and lower space footprints, while most of the smaller groups of tenants were just focused on staying in business or growing. Office space downsizing was typically not in the plans, even though the techniques to lower space per worker are easy to implement at any size. What is not easy to do is to change the culture or to take away space from existing workers without some compensating benefits. Firms that did downsize through space-sharing typically added more amenities and collaborative space. They also were more open to third-place working and telecommuting, and often provided home equipment and even some financial support for home overhead. Third-place working is defined as neither working at home nor the normal office. It could be at a Starbucks or a library or an airport or plane, for that matter. Among the more extreme examples of third-place working and increasing workplace utilization rates, defined as the percentage of a normal work day each workstation is occupied, were Procter and Gamble (P&G), Accenture and now the federal government via the GSA. Both P&G and Accenture have moved to shared standardized space models and have achieved space utilization rates greater than 85 percent compared to approximately 50 percent for most businesses. A key factor in this move to non-dedicated space is use of the cloud for data storage, making files available from anywhere. When standard space is not available, some firms use conference rooms or temporary space providers such as LiquidSpace, HQ, Regus or others that provide monthly rentals of fully furnished spaces. The costs for a typical instant workstation may run from $800 to $900 per month for 120 square feet, plus access to conference space and common areas, converting to approximately double the rate for long-term leased traditional space in bulk. The firms that are downsizing also are frequently encouraging working part- or fulltime from home offices. In order to accomplish this downsizing, firms must typically be good at productivity-based management, something that is not characteristic of many traditional firms. Even Yahoo’s CEO Marissa Mayer has not been able to effectively manage workers from home.[5] Many home-based workers also suggest they are treated like second-class citizens, so it is clear there is a learning curve for many firms, but flexible work schedules, third work places and some increases in telecommuting workers seem inevitable. Still, such trends are being embraced by the largest firms.
A more extreme form of downsizing is allowing telecommuting from home or working in third places. In a recent working paper by Kate Lister and Tom Harnish entitled “Federal Telework – Return on Taxpayer Investment”[6] the authors point out the following direct savings associated with encouraging productivity-based management and allowing workers to work from home:
- less rent and occupancy costs for the firm, with a smaller total footprint per office;
- greater worker productivity as a result of less time spent commuting, more sleep and less stress;
- absenteeism savings, for example, when a child is sick, and better employee health;
- less turnover as a result of home-based responsibilities that compete with work, for example, looking after an elderly parent;
- less need to subsidize transit and parking costs;
- more continuity of operations during disasters or power outages.
In addition to the direct savings calculated of at least $9,671 per person per year, there were many indirect societal benefits such as less carbon gas output and better air quality, and fewer insurance claims for injuries or accidents in transit. But there are many factors making it difficult to downsize, aside from culture and general resistance. In a forthcoming paper in the Journal of Corporate Real Estate, this author simulates many factors that make it difficult to hit space planning goals. In particular, the following factors are considered:
- firms do not always grow, and most start-ups go out of business within five years;
- the higher the turnover rate of workers within the firm, the harder it is to maintain a good match between leased space and space needs;
- the longer it takes to fill positions, the more excess space per worker.
- the greater the number of layers of management, each with its own type of space, the greater the space friction in that workers from one level do not move into empty spaces of workers of a different level;
- the longer the lease term, the harder it is to hit an optimal level of space per worker.
Survey data from CoreNet Global members and CBRE tenants, discussed below, was used to input reasonable assumptions. The results showed that most firms would over-shoot their space goals by 20–33 percent, so that a firm with a goal of 150 square feet may end up at 200 square feet over the term of a lease. Another factor brought out by the surveys was the difficulty of using second generation space as efficiently as first generation space, but the lower costs associated with such space more than compensated for the force fitting of a firm assuming the space of a vacated firm.
What was most counterintuitive was the empirical result that most firms have less space per worker at the start of a lease compared to at the end of a lease. One might have expected the opposite for firms that expect to grow. The reality is that firms that grow are able to negotiate new leases as necessary and that firms that do not grow are stuck with more space than they may need. When the statistics are brought to bear on how few firms actually survive long term intact, whether by merger or simply not surviving, it starts to make sense that many firms are stuck with more space than they need and that the growing firms have much more negotiating leverage than struggling firms. The typical firm today is small relative to the CoreNet Global types, and is struggling to grow or maintain business. These firms account for the significant excess space the author’s group observes per worker, especially in the aftermath of a recession.
Workplace Strategies Aimed at Greater Productivity and Green Buildings
During the past several years, the University of San Diego and CBRE have conducted a series of surveys asking tenants what they really want most in terms of space attributes. Aside from locational access and parking, the top five answers are nearly always the same. They are:
- good natural light—something that happens to be required by Leadership in Energy and Environmental Design (LEED) anyway and so the author’s group observes a strong correlation among LEED buildings and buildings with a high percentage of workers having access to natural light. Open-air designs with large amounts of glass are easier to build today with better heat reflective insulating glass;
- good temperature controls. The more people can control temperatures the better. Air flows and fans are very helpful;
- good air quality. The author’s group sees this demand often, and yet less than five percent of all the private buildings monitor and audit air quality on an annual basis, according to Healthy Buildings;[7]
- reasonable noise levels. Some ambient white noise creates a buzz which makes people feel part of a team, but too much noise or the lack of escape pods makes it unpleasant;
- collaborative spaces for meeting and amenities, such as a kitchen. Often the carrot to get people to go to nondedicated space is more collaborative space, more recreational space and more amenities. Those familiar with the writers on workplace innovation realize the importance of collaborative work environments. Those who worked with Steve Jobs, founder of Apple, have spoken about his insistence on creating an environment of chance encounters and uninhibited private exchanges, which is why he wanted people to primarily work in person.[8]
- When Pixar set up their new offices, they made sure to provide ample natural light and collaborative space.[9] Other features typical of similar firms focused on collaboration include open floor designs that let people see others working—to provide a sense of excitement and a team concept, flexible space available for any kind of use, and recreation space where employees could have fun together.
What every firm is seeking is greater productivity. More productive space commands higher rents and it is no surprise that the research on green buildings, such as those achieving LEED Silver or Gold, reveal higher rents compared to the non-green peer properties. It may be a result of saving on utilities but it is more likely that these buildings are simply more productive with great natural light.
Implications
If every tenant moved from 50 to 90 percent office utilization rates, and tolerated working in third places, total office space required would dramatically decline; however, the type of space required would often need significant retrofit. Another reality is that the excess office space is not, and will never be, in the right places. There are struggling markets with significant excess space, and in such markets downsizing will only exacerbate the problem. Since it is impossible to take excess space from a declining metro Detroit and move it to a growing city, markets with economic growth will still need to build and retrofit new space.
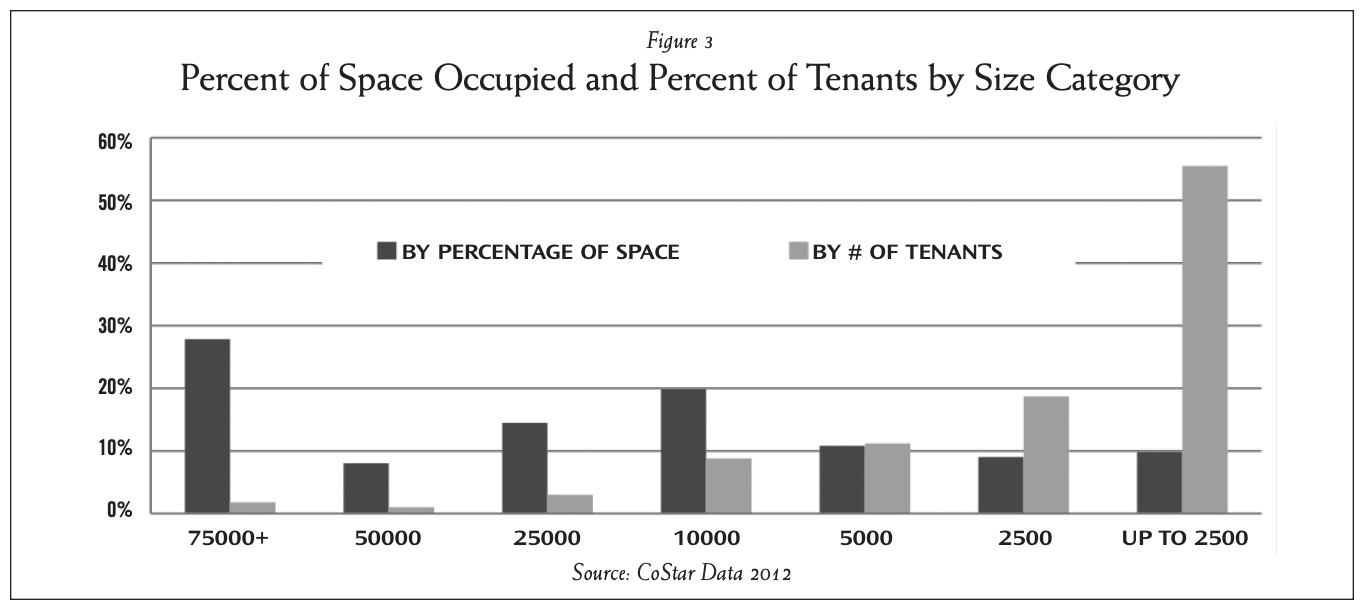
Based on input from CoreNet Global members and CBRE tenants, the larger groups of tenants are working harder to use space more efficiently, especially those with footprints over 75,000 square feet. This group tends to encourage digital storage on centralized cloud-based servers and use non-dedicated standardized space for all but the most senior of managers, and represents only 1.8 percent of all tenants in the U.S. by count, and 27.9 percent of all office space. Those using more than 50,000 square feet represent 36 percent of the total office stock. Figure 3 shows the proportion of space occupied by tenant size and by tenant count. What we see is that more than half of the tenants by count are less than 2,500 square feet in terms of the occupied footprint. But these smaller tenants only occupy 10 percent of the total market by square feet. On the other extreme, the largest groups of tenants are small by count as a percentage of the whole but occupy a significant portion of the total market. If we speculate that those firms using 50,000 square feet or more all decided to use some of the space-sharing strategies described above, and reduce their primary leased office footprint by 50 percent, moving from 250 to 125 square feet, this would be the equivalent of 540 million square feet out of some 12 billion office square feet as of 2009.[10] Historically this is equivalent to 3.6 years of average U.S. deliveries of net new space to the market, which has averaged close to 150 million square feet per year since 1983. At the same time, it is well known that little space has been added from 2009–2012, and the office stock has actually shrunk because of increasing obsolescence. Absorption has been positive for the two years prior to the end of 2013.[11]
Decreases in total office consumption based mostly on higher utilization rates take time, and it is likely that these moves toward more efficient use of space will require many years of transition. At the same time that some downsizing is occurring, we are witnessing a new kind of space being required, one that lets in more natural light with better natural ventilation, with better temperature control, and provides for more collaborative and more productive workspace.[12] With this perspective in mind, much of the existing office space is obsolete and requires retrofitting. As such, there will be substantial opportunity for both redevelopment of old space and new development of better space in the growing markets.
Conclusions
The largest firms have embarked on a path toward more efficient use of space seeking much higher utilization rates. This is possible with extensive use of cloud-based storage of files, standardized non-dedicated space, and a policy that allows great flexibility in terms of where employees work. Slightly more than a third of the market is represented by larger firms, and many of these seem to be attempting to downsize footprints over the next several years. Others will follow over time. Still the culture of private space seems to remain entrenched in many sectors of the U.S.—most law firms for example—and the transition to smaller footprints may not occur at speeds greater than the normal net increases in office demand. Still some portfolios heavy with large private sector tenants and federal government tenants may be caught off guard by the significant downsizing plans of their occupants.
The need for collaboration and innovation works against the trend of working at home or even in private offices.[13] Some firms have also added significant play space or free food in attempts to keep workers happy and retain talent.[14] Overall, it’s reasonable to expect the spread from lows to highs of square feet per worker figures to widen over the next several years, as some firms reduce footprints significantly while most others maintain current practices with private dedicated space. Few firms will ever be able to hit their target allocations of space per worker.[15] The reasons are quite straightforward.
Firms must anticipate growth and turnover, time to fill positions, and the types of spaces that are required. Temporary office space, using conference rooms, or letting employees work at home may alleviate some pressure when a firm reaches capacity, but temp space alternatives are fairly expensive compared with long-term leased space. Firms retaining a multi-level hierarchy of management, with private dedicated office space configuration as a signal of rank, will find it harder to use space efficiently, just as second-generation tenants do not fit as efficiently into any given space as first-generation tenants.
Other trends that might help explain the seeming excess of space compared to space planning targets include the trend toward multi-office branches and the existence of global firms that require occasional office space for visiting colleagues and clients. Many a senior manager retains an empty office in one city while using a visiting office space in another city.
Based on reduced space usage, the demise of the office market has certainly been exaggerated, and a continuation of space demand in excess of the targets espoused by a few large public corporations and space planners is more likely to be seen. Moving forward, the expectation is that some firms will achieve square footage per worker of less than 100 square feet, but given the cultural impediments and the challenges of predicting growth rates, figures averaging 150–180 square feet per worker phasing slowly towards even lower figures at the end of the decade are more likely to be seen. This is a significant reduction in space per worker, but it parallels a need to retrofit much of the existing space to provide more collaborative team space and healthier, more productive environments. Ultimately, landlords are not selling space but rather productivity. More productive environments with better natural light, temperature and air controls, cleaner air and controllable noise are more productive and will command rental premiums.
Resources
CoreNet Global and several research reports at http://www.corenetglobal.org/.
International Facility Management Association and several research reports available at http://www.ifma.org/.
Carn, N., J. Rabianski, R. Racster and M. Seldin, Real Estate Market Analysis, Englewood Cliffs, N.J., Prentice Hall, 1988.
Clapp, J.M., Dynamics of Office Markets, AREUEA Monograph Series No. 1, Washington, D.C., Urban Institute Press, 1993.
Clapp, J. M., Dynamics of Office Markets: Empirical Findings and Research Issues, AREUEA Monograph Series No. 1, Washington, D.C., Urban Institute Press, 1993.
Clapp, J.M., Handbook for Real Estate Market Analysis, Englewood Cliffs, N.J., Prentice Hall, 1987.
CoreNet Global, “Reducing the Portfolio and Maximizing the Use of Existing Space,” Research Report, June 2009, p.14.
Del Casino, J.J., “A Risk Simulation Approach to Long-Range Office Demand Forecasting,” Real Estate Review, Vol. 15, No. 2, 1985, pp. 82–87.
DiPasquale, D. and W. Wheaton, Urban Economics and Real Estate Markets, Prentice Hall, 1996, Chapter 12.
Dowall, D.E., “Office Market Research: The Case for Segmentation,” Journal of Real Estate Development, Vol. 4, No.1, 1988, pp. 34–43.
Gibson, V., “Flexible Working Needs Flexible Space?” Journal of Property Investment & Finance, Vol. 21, No.1, 2003, pp. 12–22.
Grissom, T.V. and J.L. Kuhle, “The Space Segmentation Technique (ST3): A New Approach to Market Analysis,” Real Estate Issues, Vol. 8, No. 2, 1983, pp. 21–29.
Hakfoort, J. and R. Lie, “Office Space Per Worker: Evidence from Four European Markets,” The Journal of Real Estate Research, Vol. 11, No. 2, 1996, pp. 183–196.
Howarth, R. and E. Malisia, “Office Market Analysis: Improving Best Practice Techniques,” The Journal of Real Estate Research, Vol. 16, No. 1, 1998, pp. 15–34.
Kimball, J.R. and B.S. Bloomberg, “Office Space Demand Analysis,” Appraisal Journal, Vol. 55, No. 4, 1987, pp. 567–577.
Lister, Kate and T Harnish, “Federal Telework – Return on Taxpayer Investment,” Global Workplace Analytics, see www.globalworkplaceanalytics.com.
Lex, R.A., “Marketing Studies for Office Buildings,” Real Estate Review, Vol. 5, No. 2, 1975, pp. 101–103.
Liang, Y. and J.H. Kim, “Demand for Office Space,” Real Estate Finance, Vol. 15, No. 2, 1998, pp. 37–44.
Maisel, S. J, “Demand for Office Space,” Working Paper pp. 89-161, Berkeley, Calif., Center for Real Estate and Urban Economics, 1989.
McDonald, J.F, “A Survey of Econometric Models of Office Markets,” Journal of Real Estate Literature, Vol. 10, No. 2, 2002, pp. 223–242.
Miller, N. and D. Pogue, “Green Buildings and Productivity,” Journal of Sustainable Real Estate, Vol. 1, No. 1, Fall 2009.
Miller, N., D. Pogue, J. Saville and C. Tu, “The Operations and Management of Green Buildings in the United States,” Journal of Sustainable Real Estate, Vol. 2, No. 1, 2010, pp. 5–66.
Miller, N. “Workplace Trends in Office Space: Implications for Future Office Demand,” forthcoming in Journal of Corporate Real Estate, 2014.
Rabianski, J., “Office Market Demand Analysis,” Real Estate Review, Vol. 33, No. 2, 2004, pp. 16–33.
Rabianski, J., “Linking Particular Office Marketability to the Market,” Real Estate Review, Vol. 24, No. 3, 1994, pp. 83–86.
Rabianski, J. and K. Gibler, “Office Market Demand Analysis and Estimation Techniques: A Literature Review, Synthesis and Commentary,” The Journal of Real Estate Literature, Vol. 15, No. 1, 2007.
Ragas, W.R., R.L. Ryan and T.V. Grissom, “Forecasting Office Space Demand and Office Space, Report 4,” Chicago, Ill., American Institute of Real Estate Appraisers, 1989, pp. 29–42.
Ragas, W.R., R.L. Ryan and T.V. Grissom, “Forecasting Office Space Demand and Office Space per Worker Estimates,” SIOREF Perspective, March/April 1992, pp. 2–8.
Shilton, L., “The Eight Myths of Office Demand Forecasting,” Real Estate Finance Journal, Winter 1994, pp. 67–72.
Schloss, N., “Technical Note: Use of Employment Data to Estimate Office Demand,” Monthly Labor Review, 1984, Vol. 107, No. 12, pp. 40–44.
Silver, E.A., D.F. Pyke and R. Peterson, “Chapter 10: Style Goods and Perishable Items,” Inventory Management and Production Planning and Scheduling, John Wiley & Sons, Third Edition, 1998.
Wheaton, W.C., “The Cyclic Behavior of the National Office Market,” AREUEA Journal, Vol. 15, No. 4, 1987, pp. 281–99.
White, J.R., “The Office Building,” Counselors of Real Estate, 1993, Chapter 9.
Wincott, D.R. and G.R. Mueller, “Market Analysis in the Appraisal Process,” Appraisal Journal, Vol. 63, No. 1, 1995, pp. 27–32.
Endnotes
1. The Government Services Administration has plans to reduce its workspace to 82 square feet per worker at its own headquarters. Source: Colliers, March 28, 2012.
2. Some firms will allow employees to work at home or alternative workplaces when they run up to 100 percent utilization. Others will rent temporary space for overflow demand.
3. NAIOP, the Commercial Real Estate Development Association, originally stood for National Association for Industrial and Office Parks. In 2009 NAIOP dropped the words behind its acronym, which no longer reflected its current membership composition.
4. Source: CoStar data in September 2013.
5. http://www.businessweek.com/articles/2013-02-28/the-excessiveuproar-over-marissa-mayers-telecommuting-ban.
6. Kate Lister is with Global Workplace Analytics and Tom Harnish is with Telework Research Network.
7. See http://healthybuildings.com/.
8. For example, Greg Brandeau, formerly of Pixar and The Walt Disney Studios, worked with Steve Jobs and discussed these points on September 6, 2012, at the Global Forum on the Culture of Innovation by the Aspen Institute and the Urban Land Institute in San Diego.
9. For examples of similar workplaces around the world see http://www.hongkiat.com/blog/creative-modern-office-designs/.
10. Using CoStar estimates on the size of the market based on “Slicing, Dicing, and Scoping the Size of the US Commercial Real Estate Market,” by A. Florance, N. Miller, J. Spivey and R. Peng, Journal of Real Estate Portfolio Management, Vol. 16, No. 2, 2010.
11. Source: CoStar reports. 12. Listed above in RESOURCES, see the work of Miller and Pogue (2009) or Miller, Pogue, Tu and Saville (2010). To achieve LEED certification, as developed by the U.S. Green Building Council, requires that 75 percent of the occupants have access to natural light. See www.usgbc.org. LEED certified office space now accounts for about 15 percent of the space of all U.S. office space. 13. Indeed Marissa Mayer of Yahoo announced in early March of 2013 that working at home would no longer be allowed at Yahoo. Best Buy followed suit soon thereafter.
14. For example, IDEO, Microsoft, Google, Facebook and Pixar all provide significant recreation facilities within their main offices. See http://www.hongkiat.com/blog/creative-modern-office-designs/ or http://www.fastcodesign.com/1664735/what-schools-can-learn-fromgoogle-ideo-and-pixar.
15. “At the end of the day you never have the right amount of real estate,” James Watson, CEO of CT Realty Investors, Sept. 13, 2012.