 Mount Holly, New Jersey. Photo: Tippman98x/Shutterstock.com
Study in collaboration with Colliers Engineering & Design.
Executive Summary
In the early 1950s when the United States Department of Agricultural Soil Conservation Service (“USDA SCS”) Curve Number Method was introduced, there were essentially two types of watersheds under consideration, rain-fed agricultural fields and forests. Forest may not have the Hortonian overland runoff condition that an agricultural field has. It has a tree canopy and underbrush and can attenuate the runoff from a storm event. A Forest Service paper reportedly stated that forests in the Northeast can absorb up to several inches of rain.
In 1954, the first USDA Natural Resources Conservation Service (NRCS) (formerly SCS) National Engineering Hydraulic (NEH) handbook came out.1 There was a category for woods. In 1975, the USDA SCS released TR-55 (Technical Release 55), which had the same category for woods.2
Woods were internally understood as a wooded farm stand and/or parks. Woods are not considered a full forest ecosystem. To the public, however, woods were synonymous with forests. USDA NRCS included the concept of hydrologic soil groups (HSGs) to simplify the modeling of stormwater runoff by categorizing all types of soil into one of four Hydrologic Soil Groups HSGs.
There are four types of soils, referred to as “HSGs:
A. Sand, loamy sand, or sandy loam
B. Silt loam or loam
C. Sandy clay loam
D. Clay loam, silty, clay loam, sandy clay, silty clay, or
clay
In 1986, TR-55 was revised, and limitations were added to the Technical Release. Among the limitations was the mention that the Curve Number Method could not be applied to forests under certain circumstances.3 In particular, it is the consensus of most forest hydrologists that forested watersheds with Hydrologic Soil Groups A (and possibly B) tend to absorb a substantial amount of rainfall before any overland flow occurs. In 2017, the American Society of Civil Engineers (ASCE), American Society of Agricultural and Biological Engineers (ASABE NRCS) Task Group on Curve Number Hydrology, made recommendations to USDA NRCS on the update of NEH4 Part 630 Hydrology Chapter 9 that the Curve Number was not applicable to forests with HSG A (and possible HSG B) soils. In the case of this study in the Pinelands Forest Preserve, the forested soils are considered mostly HSG A soils.
On May 13, 2019, The Counselors of Real Estate (CRE) Foundation funded a 2-year Stormwater Management Study which has proven that preserving existing forested areas in development sites with HSG A soil is a Best Management Practice (BMP) for stormwater management. These reports are “The Complacent Violent Response in Applied Hydrology: Application to McDonalds Branch, New Jersey Pinelands”, “Technical Appendix – A Review of the 2011 flood at McDonalds Branch in Byrne State Forest”, and “BMP Planning and Uplands Storage in the New Jersey Pinelands: A reconnaissance”. 4, 5, 6
In New Jersey, as in other states, Green Infrastructure is considered a BMP, particularly with the planting of trees in porous soils as a designed bioretention system. Bioretention systems are modeled after natural ecosystems like forested areas. Forested Areas utilize the natural process of infiltration to reduce overland flows, filter stormwater, absorb nutrients, and route stormwater into the sub-surface aquifer.
The bottom line of this study is that, when building new developments in areas of the country with forested HSG A & likely also B soils, keeping existing trees and forested areas or planting new trees within the highly porous soils has environmental and economic benefits. The environment benefits from the cleaning of stormwater runoff, recharging of stormwater into aquifers, and by preserving existing trees and planting new trees, thereby reducing the development site’s carbon footprint all while reducing the deleterious effects of downstream flooding. The economic benefits come from reducing land development costs and increasing revenue when compared to more invasive/construction-intensive approaches. By using the natural process of infiltration instead of installing structural systems like pipes, culverts, detention, and retention basins, site development costs could be dramatically reduced. Revenue increases as the areas of a development site traditionally used for these structural systems might allow for more development under certain circumstances due to the inherent efficiency of such systems.
The CRE® Foundation Funded Stormwater Management Study
The study involved investigating stormwater patterns along the McDonalds Branch Tributary to the Rancocas River, in the Pinelands Forested National Preserve of New Jersey. The Pinelands contain 1,466 square miles which represent 19 percent of the total land area in New Jersey. The Pinelands area is the largest HSG A area in the State. The Pinelands and the other portions of Southern New Jersey with HSGA (and HSG B) soils cover about 1/3 of the State.
The study was to investigate the use of forest with HSG A (and possibly B) soils as a Best Management Practice for infiltrating stormwater runoff from development. Research of USDA NRCS Curve Number Method and the data from USGS McDonalds Branch gage station were used to complete this study.7
The results of the study challenge the current New Jersey regulatory regime which does not take infiltration into account when calculating runoff. The current regulatory regime is based on a statistical model which was developed in the 1940s and published in 1954 referred to as the “Curve Number” or “CN” method, which was based on 24 agricultural watersheds’ data, nationwide. Its objective is to estimate direct overland runoff from storm rainfall. Use of the CN method, based on regulations and/or present-day design requirements, can tend to remove forested areas from development sites since the methodology does not recognize the full stormwater management potential of the system. The New Jersey regulatory regime does not understand that not all watersheds in the State act the same in rainfall events. It fails to acknowledge that the existing hydrology can be completely subsurface flow and therefore overland runoff models such as TR-55 are inappropriate. This study demonstrates that there is no consistent TR-55 Curve Number for forests with HSG A and possibly HSG B soils. Consequently, forest systems are often destroyed and replaced with structural systems (i.e. – detention and, or retention basins) which hold stormwater until after the storm event has passed and then gradually release and routes the stormwater through pipes and culverts to nearby waterways which carry it away. In contrast, the study demonstrates that HSG A forested areas have a capacity to infiltrate stormwater that is significantly greater than modeling with the CN methodology indicates.
History of the Curve Number Method for Stormwater Management
The Curve Number was introduced in 1954 by the U.S. Department of Agriculture Soil Conservation Service for the sole purpose of managing stormwater in agricultural watersheds. The Watershed Protection and Flood Prevention Act (PL-566) authorized the USDA NRCS to help local organizations and units of the government plan and implement watershed projects. In the mid-1970s, the USDA SCS developed Urban Curve Numbers based on 10 watershed studies and began to use it to regulate the management of stormwater for all new development in non-agricultural areas with all soil types.
In the early 1970s, Somerset County, New Jersey, in response to:
- the destruction by Tropical Storm Doria in 1971 and the August 2, 1973, extreme storm event and
- the need to develop a procedure to calculate a curvilinear hydrograph to route stormwater through detention basins
developed the Somerset County version of USDA SCS TR-55.8 Initially, not all of New Jersey Counties adopted Somerset County’s version of TR-55, although it was considered a regulatory tool by Somerset County Planners and Engineers. The Somerset County Curve Number Procedure worked in Somerset County, but not necessarily everywhere else in the State.
The New Jersey regulated stormwater community would not be aware of the soil and land use limitations of the Curve Number Method for years to come.
At the same time (1975), USDA NRCS came out with its authoritative TR-55 procedure nationwide.9 USDA NRCS refers to its TR-55 as a guidance document and not a regulatory tool for field personnel. Notwithstanding, today many states in this country use this guidance procedure as a regulatory tool.
To the regulators and regulated communities, USDA NRCS has always been perceived as an “Authority” in hydrology and therefore is not generally questioned by the public. In the mid-1970s the TR-55 procedure was perhaps one of the most popular tools stormwater design engineers had available.
Around the late 1960s or early 1970s, detention basins were just being designed based on the Rational Triangular hydrographs in New Jersey. From that time to 1981 in New Jersey, there was no official statewide procedure to design detention basins. In 1981, the NJDEP adopted the Curve Number method for stormwater management based on the recommendations of the Delaware Valley Regional Planning Commission.10
The result was that all residential and commercial land development regulations require recognition of the effects of stormwater runoff on downstream floods, and for insurance purposes, avoidance of flood plains for rare events, commonly a 100-year return period. In watersheds without on-site long-term data (i.e., essentially most situations) estimates of these rare flood flows and of their flood plains must be made by indirect engineering methods. These methods draw from regional rainfall databases and models of rainfall-runoff responses based on knowledge of soils and land cover.
As previously stated, most stormwater regulations in this country require or endorse the use of USDA NRCS rainfall-runoff hydrology procedures (i.e., the Curve Number method) for the design and analysis of proposed land development projects. While originally generated as in-house USDA NRCS guidance documents, state and local agencies have adopted these procedures in a regulatory and planning environment. With the authority and imprimatur of USDA NRCS, the procedures have been taken as a credible state-of-the-art stormwater management tool for all types of land and development, not just the agricultural lands it was intended for.
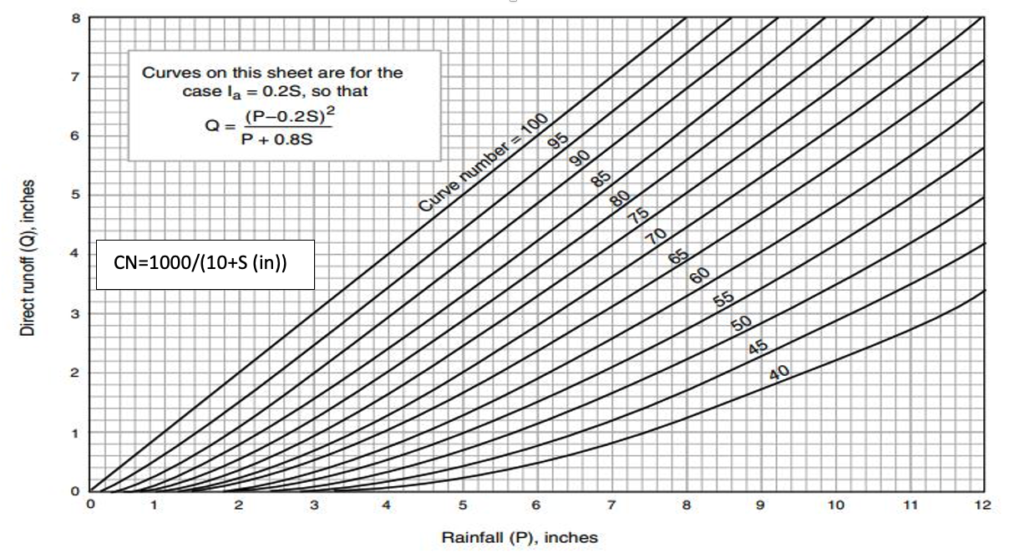
The method draws its name from its primary input parameter “Curve Number”, or CN. In application, it (CN) is estimated from handbook tables on the basis of soils and land use conditions and varies in value between 1 and 100. In usage, reliable runoff calculation results hang on accurate estimates of the “Curve Number” parameter.11 It has often been (incorrectly) seen by the engineering and regulatory community as a coefficient of stormwater runoff similar to the Rational C Coefficient. Rather, the curve number is more complex with results varying based on the storm, and variable formula “constants” and implementing formula structures.
Figure 1 is the method’s most common configuration and shows stormwater runoff from storm rainfall for different Curve Numbers. Parenthetically, it should be noted that while USDA NRCS is the authoritative source on the method, it is not an enforcement, certifying, endorsing, monitoring, or review agency for the use of their practices by others. Local applications are local responsibilities.
Figure 1: Storm runoff from rainfall for a range of Curve Numbers, and the case of Ia=0.20S.
The runoff equation is only valid for P>0.2S, Q=0 otherwise.
Applications in New Jersey and the Pinelands
Currently, NRCS Hydrology practices are mandated by the New Jersey Department of Environmental Protection, Department of Community Affairs, Soil Erosion and Sediment Control Program, Department of Transportation, and most county and municipal governments in New Jersey.
Pinelands Applications
It is also mandated by the Pinelands Commission, which was created by the National Parks and Recreation Act of 1978. Its Comprehensive Management Plan (CMP) completed in 1980, called for “runoff prediction methodology to determine rates and volumes of allowable discharges shall be that of the U.S. Soil Conservation Service as described in the SCS National Engineering Handbook, Section 4 or Technical Release 55.”12, 13 Further, it specified that the volume and rate of runoff generated from the parcel by a fifty (50-year) storm of a 24-hour duration – as calculated in accordance with the United States Soil Conservation Service Technical Release No. 55 or the SCS NationalEngineering Handbook – will not increase as a result of any development of the parcel.”
In 1979, alert to the geographic uniqueness of the Pinelands, the Commission felt the need to “establish realistic Curve Numbers for the well-drained pineland soils.” The Department of Agricultural Engineering at Rutgers University undertook this, and submitted findings in January 1982, concluding that the Curve Number for wooded areas in the Pinelands as listed in TR-55 tables are “correct”. With these actions, the Curve Number method was specified for event hydrology in the Pinelands Commission area, and the existing handbook table values were taken as valid. Although the CMP stormwater management regulations have evolved over time, the use of the NRCS methodology has remained constant and is the only method allowed to be utilized. In fact, the Pinelands Commission is codifying its current practice of allowing only the NRCS methodology in the proposed CMP stormwater rules promulgated on July 19, 2021.
Validity of the Curve Number Method
Independent studies in the 1970s and 80s explored the validity of the CN model and the general event rainfall (P) – runoff (Q) at the small watershed level. Surprisingly, “Some watersheds were found to perform quite differently from the basic runoff response patterns, leading to great differences between the (CN) model and reality.”14 In addition, it was shown that the found CN parameter value itself varied with the storm rainfall: That is, the Curve Number was not a constant coefficient from storm to storm as most users believed, and the CN model itself is neither universal nor uniform.
Prompted by these findings, in 1990, “The Natural Resources Conservation Service (NRCS) and the Agricultural Research Service (ARS), both agencies of the U.S. Department of Agriculture, formed a joint workgroup to assess the state of the Curve Number method and to chart its future development.”15 In 2015, a joint effort of USDA, ASCE, and ASABE reviewed Chapters 8, 9, 10, and 12 of USDA NRCS NEH4 Part 630 Hydrology, and reported on September 30, 2017.16 The following discussions carry concepts included in the report.
An unexpected pivotal finding from this analysis was the emergence of three (3) distinct clusters in rainfall-runoff patterns. While previously unappreciated, they are currently (2020) recognized in professional literature but have not yet been incorporated into official USDA-NRCS hydrology procedures, and thus have not been passed down to state and local users or client organizations.
These real-world departures from the CN method affect applied hydrology in “non-standard” areas such as the New Jersey Pinelands.
These three cluster types are: 1) Standard, 2) Complacent, 2) and 3) Violent. The Standard behavior is the most common, and fits the Curve Number model best, though only with the rainfall-dependent adjustment as shown in Figure 2. Complacent behavior is common in some land types and is of interest in the Pinelands. Violent events are rare (but quite consequential) extreme events springing from Complacent beginnings, with large storms and usually pre-wetted in-situ conditions. The following paragraphs and figures show these cluster types found and demonstrated from data analysis.
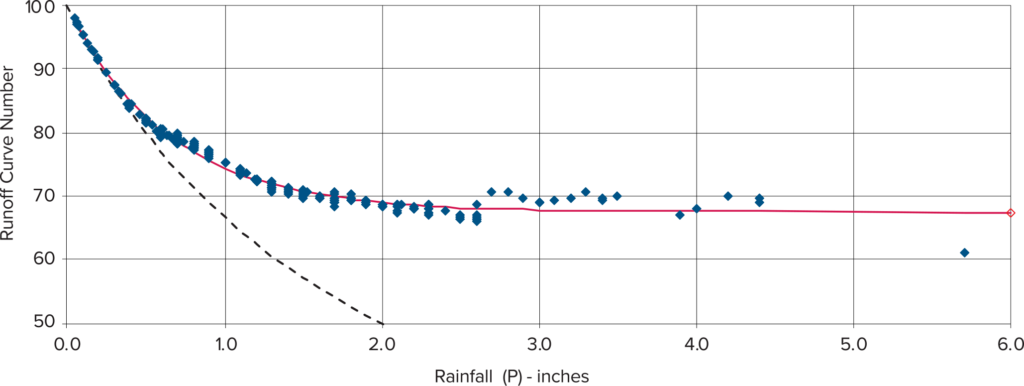
Standard behavior is the most common scenario for regulators and design engineers. The observed CN declines with increasing storm size but approaches a near-constant value with increasingly larger storms. The constant value (CN∞) is approximated by Handbook tables. An example of this behavior is shown in Figure 2. About 80% of all watersheds evaluated showed this pattern.17 The plot of CN vs. rainfall displays this bias and the storm magnitude at which the bias becomes insignificant.
Figure 2: Standard behavior as shown for Tifton Georgia, USDA-ARS Watershed 3 from 1970-80
The drainage area is 3,872 acres, and 284 events are covered. CNs are determined from measured rainfall (P) and runoff depths (Q) and inverse solution of the runoff equations given in Figure 1. The asymptotic CN (or CN∞) for this example is about 68 The dashed line shows the minimum possible values, or the rainfall at which runoff is initiated for the CN shown. In this example, and in those that follow, the return periods for the rainfall and the runoff are matched.
Complacent behavior is shown by CN declining with increasing rainfall but with no appreciable tendency to achieve a stable value. Thus, a stable Curve Number cannot be safely determined from data that exhibit this pattern. An example of this behavior is shown in Figure 3.
It is a low and linear and unthreatening runoff response but is the lead-in for the much rarer Violent condition. The Complacent response is better described by simply Q=CP, with “C” in the range of 0.01 to 0.05. This contrasts with Q=(P-0.20S)2/(P+0.80S) as widely accepted and shown in Figure 3.
Figure 3: Complacent Behavior
No constant CN is determined for this data. The Complacent runoff ratio (Q/P) inferred from the above plot is about 0.005. The data is for West Donaldson Creek, Oregon, on the Malheur National Forest. Drainage area is 960 acres, and there are 48 events from 1978-84.

Complacent behavior has been typically identified with watersheds having high-infiltration soils, but in which a small fraction of the watershed is in an impervious condition, such as the stream channel and pond surfaces. Heavily forested watersheds in humid zones with continuous flows often show Complacent behavior. In New Jersey, this is the case for McDonalds Branch in the Pinelands (see “Complacent Violent Curve Numbers in Pinelands NJ” and “BMP Planning and Uplands Storage in the New Jersey Pinelands: A reconnaissance”, a report by RH Hawkins).18, 19 With deep sandy soils, there is essentially NO evidence of traditional overland flow. Applying the current CN method to these sites would be inappropriate and lead to unnatural – and higher – estimates of storm response.
Violent behavior is indicated when the runoff rises suddenly from an in-progress complacent response at a threshold rainfall value (Pt). The resulting CN asymptotically approaches an apparent higher constant value. At rainfalls in excess of the threshold, a distinctly higher fraction of the rainfall becomes runoff.
An example of CN Violent behavior is shown in Figure 4. Violent behavior generates a high response to rainfall, but only above a high threshold rainfall, Pt. If storm rainfalls above the threshold are rare, then examples of it in experience or data are rare as well. In the 66 years of USGS McDonalds Branch record, there were no identifiable events of Violent response. Nevertheless, the rare major catastrophic floods may well arise from rare instances of Violent response.
Figure 4: Violent Behavior example from Berea Kentucky, Watershed 6, US Forest Service
Drainage area is 287 acres and there are 84 events from 1969-76. The asymptotic CN for this example is about 93. The threshold rainfall Pt is about 1.0 in. The incremental runoff rate (or b2) in the range of P=4 inches is 0.82. The lead-in complacent limb is not shown but would be about Q=0.02P

The direct equation for runoff, in this case, is Q=CP+b2(P-Pt), where Pt is the threshold rainfall and b2 is the watershed incremental runoff fraction. Note that the term “CP” in the above is the lead-in Complacent runoff as described in a preceding paragraph.20
Storm Runoff in the Pinelands
The area of interest here is the forested pine and hardwood-covered sandy lands of central and southern New Jersey. As a distinctive feature of New Jersey geography, the Pinelands and the other portions of southern New Jersey with HSG A (and HSG B) soils cover about 1/3 of the state of New Jersey. They are under some development pressures, and the sandy soils are conveniently suited to the concept at hand.
This area is similar to the shoreline areas of Delaware, the Eastern shore of Maryland, Long Island, and other similar regions of the United States. The Pinelands are characterized by continuous deep, porous, sandy soils, which accept, store, detain, and transmit rainwater easily. With gentle topography and a rainy maritime climate and pine-hardwood forest cover, long-term streamflow is supplied by rain-fed flow-through groundwater sources.
The characteristic sandy soils dominate the geology, ecology, and hydrology of the Pinelands. As a result, there is little storm runoff and essentially no overland flow. These factors are not consistent with the origins and historical applications of the Curve Number method. Environmental conditions and recorded storm response show that this is clearly a case of Complacent response (see “Complacent Violent Curve Numbers in Pinelands NJ” report by RH Hawkins).21
Total rainfall (and limited snowmelt) in the Pinelands, which averages roughly 48 inches per year, finds a number of different pathways through the hydrologic system.
First, the rainfall and snowmelt infiltrate directly into the sandy soils, with subsequent evaporation, transpiration, and groundwater recharge. Excluding the minor items of canopy and litter interception, the entire rainstorm enters the soil. Litter is defined as, “uppermost layer of a forest floor, consisting of slightly decomposed leaves, needles, twigs, etc.” From the information at hand from small watersheds on the undeveloped Pinelands, this is about 95% – 98 % of the rainfall and snowmelt. This soil profile water is either used by the vegetation, evaporates from the soils directly, joins to local and regional groundwater and eventually to long-term streamflow, or passes through to the underlying Cohansey-Kirkwood formations and aquifer. This “detain, store, and pass through:” activity is a major function of the sandy soil profiles in the Pinelands.
Second, some of the rain falls directly on channel surfaces, wetlands, and ponds. Seemingly minor, it is the major source of storm runoff from undeveloped areas in the Pinelands. In fact, rain falling directly on water surfaces is essentially the only runoff creating process on undeveloped upland watersheds.
From the information at hand, roughly 1 – 5 % of the pineland watersheds are in water surface. This produces the unconventional Complacent storm runoff pattern, which is a distinctive mark of the Pinelands surface water hydrology. This is not consistent with the Curve Number concept as currently employed.
Third, the limited developed areas and agricultural lands generate runoff from a series of processes, which is conveyed to local drainages and downstream sea-level disposal. Within the past several decades, and where required/permitted by regulation, rain-generated water collection from development activities may be directed to detention and recharge ponds, or into surface water conveyance. This amount seems to be fairly minor.
Fourth, lateral runoff from highways, parking lots, and impervious surfaces – unplanned, unnoticed, and perhaps unregulated – flows largely unnoticed onto receiving natural lands. Soaking in directly, there is little or no evidence of downstream channeling or erosion. Examples are common, and its success is a measure of the natural properties of the Pinelands: sand-dominated soils, low slopes, and persistent forest cover. It is this phenome that can be used as a Best Management Practice for stormwater management.
Stormwater Management Opportunities in the Pinelands
Accounting for excess rainstorm runoff generated by land developments is a major concern in urban runoff management, and a project’s acceptance and success may hang on this issue. Developed areas include subdivisions, highways, and commercial areas and the like, all of which have elements of impervious cover that lead to copious amounts of unnatural runoff and local flooding.
Complacent-Violent Application
In the Pinelands the soils are extremely porous, deep, and sandy. During storm events, rainfall infiltrates into the soil directly and there is little to no surface overland flow. As it moves downwards towards the water table, it is diminished and partially retained in soil pores, and if sufficient, may feed the water table. It eventually drains as shallow subsurface flow to nearby streams or moves to a regional groundwater table. With this, the overland flow processes and quick runoff flow associated with the Curve Number method are inappropriate. A Complacent-Violent response is more probable and justified.
Detention/Infiltration Basins
In New Jersey, infiltration and detention basins are used to try to mimic existing hydrologic conditions. Originally, in the Pinelands Commission stormwater management regulations, the design engineer was “to account for the difference in the 50-year storm event.” This led to designing infiltration basins in the Pinelands National Preserve.
Today, infiltration (including bioretention) basin and detention (including wet ponds) basin designs have gravitated to accommodating the water quality management goals from the water quality storm, and the 2, 10, and the 100-year design storm events. Detention basins attempt to match pre-development hydrology, that is essentially subsurface flow in the forested Pinelands, to an overland point discharge at the surface outfall. However, the detention basins introduce runoff to the streams in hours instead of days. Infiltration basins, when designed, constructed, and maintained to current NJDEP standards, mimic the travel of stormwater management to the stream in days.
Direct Soil Storage
It should be pointed out that the surface water Complacent-Violent rainfall-runoff process results from the deep sandy soil resource. Infiltration basins attempt to utilize the same process and soil profiles in directed runoff disposal. Both infiltration basins and direct soil storage (e.g. forested bioretention) operate to moderate storm flows. It can be recognized that these soil profiles, and their ability to absorb, extract, hold, and transmit infiltrated rainwater are pivotal and underutilized resources in stormwater management.
Over the years, field personnel of the New Jersey Soil Conservation Districts have noted the significant capacities of forested areas in South Jersey to readily manage stormwater runoff from adjacent impervious surfaces. This observation leads to the notion of using the abundant local deep forested sandy soil profiles more directly and – by specific intent and design – to accept excess storm runoff from developed areas. This process has technical precedent in groundwater recharge, except that here the soil profile is the receiving aquifer body, albeit in a transient capacity. A reconnaissance study (see “BMP Planning and Uplands Storage in the New Jersey Pinelands: A reconnaissance”, a report by RH Hawkins) suggests a large potential unutilized water storage capacity remaining in the Pineland soils as a stormwater BMP.
Potential Benefits
If successfully applied, using trees and forested areas could free up space-consuming infiltration/detention ponds and eliminate the cost of building them. Further, as a living, well-established ecosystem, they do require some maintenance, especially as compared to a manmade system. This approach is entirely consistent with the NJDEP mandate for Green Infrastructure. The aim here is to develop and discuss the questions that this concept induces: that – as an alternative to traditional methods of constructing detention/infiltration basins, deeply forested soil profiles could be used to treat, store, and detain storm runoff from developed sites, using the runoff “storage” potential in the Pineland soil profiles to manage stormwater runoff.
In summary… Benefits of Pinelands Forest Areas
- Make use of the highly absorptive characteristics of the Pinelands forested soil profiles as an infiltration practice instead of removing trees and constructing detention/infiltration basins, pipes, and culverts to route stormwater to receiving water bodies.
- Make use of the forest areas as recipients of stormwater outfalls. This could provide relief from piping through buffer areas to the stream. It would mimic the existing natural hydraulic inefficiency of the watershed.
- Since the forest areas of the Pinelands are not an overland flow condition and the Curve Number is considered Complacent-Violent, then determinations of Flood Hazard Areas (i.e., unbuildable areas) would need to rely on stream gauge-based modeling approaches.
Sizing the Amount of Forest Area Needed
There are three proposed preliminary methods to estimate the amount of forested area needed to handle the New Jersey Water Quality storm along with the 2-, 10-, 50- and 100-year storm events.
- Empirical Method. Based on known roadside forested areas and the amount of impervious surface draining into these areas, a loading ratio is used to size the amount of forest area needed.
- Conservation of Rates Approach. Equating the runoff rate to the Ksat infiltration rate. This is dependent on the ability of the forest profile to transmit the runoff from the overland infiltration rate.
- Volume of the forest soil profile. Using the volume of the soil porosity to “capture” the design storm. The forest profile can be quite variable.
Factors of safety in all three approaches can be reduced when existing topographic conditions allow for the construction of a “backstop” berm to create a partially forested bioretention basin as a backup. Forested bioretention basins can also be designed as the primary BMP when existing topographic conditions allow. These would be sized and routed in the same fashion as standard infiltration/bioretention BMPs. This approach can be adopted in the short term as an incremental step to using forested areas in HSG A (and HSG B) soils as BMPs in stormwater treatment and would be conducive to long term studies to gather data to support methods to size non- and partial-bermed forested bioretention areas such as the three contemplated above.
Sizing Concepts
1. Empirical Method. Based on known areas
Based on known amount of forest tracts receiving runoff from known amount of impervious surfaces, the amount of forested area needed is 8.3 acres.
11.5 acres (developed) + 8.3 (forest area needed) = 19.8 acres < 25.5 total acreage of the site OK
2. Conservation of Rates Method
The rate of runoff must be equal or less than the infiltration and transmissivity rate of the forest soil profile.
Consider a simplistic approach of:
(Forest Area + road area) x i = Forest Area x Ksat
where i = rainfall intensity in inches per hour based on Tc
Ksat = saturated hydraulic conductivity (in/hr) (infiltration rate capacity)
Rearranging the terms;
(Forest Area)/ (road area) = i/(Ksat – i)
Forest Area = i/ (Ksat – i) x road area
This approach depends on;
-
- Unlimited available storage
- Ksat >> i intensity of rainfall
- For forest HSG A soils, there are no recommendations for a safety factor.
For: Design rainfall of 9.31 inches (100 year event)
Ksat of 20 inches per hour
Tc of 6 minutes
The amount of forested area needed is 8.75 acres
11.5 acres (developed) + 8.75 (forest area needed) = 20.25 < 25.5 acres entire tract ok
3. Volume Approach Method
Receiving area required per unit of source area.
“How much “forest” receiving area (e.g., ft2) should be allocated for each unit of upslope source area ft2. “Forest” here just means the rate-unlimited infiltrating lands receiving the storm runoff, such as the pine sands of New Jersey.
Analysis proceeds by volumes: 1) runoff volume from the source area, and 2) volume represented by the profile storage in the “forest” area, which depend on the depth and porosity. The storage space in the soil profile must equal or exceed the volume of water supplied.
The runoff from the contributing area (in ft3) is Q(in)Area(ft2)/12. Q can be calculated from such as the CN equation, or simply the rainfall (P)/12, if impervious source areas are assumed. So that
Runoff volume (ft3) = Storage available (ft3) [1]
The storage available is the depth above the seasonal high-water table (d, in ft) x effective porosity (θ, as a decimal fraction) x area of receiving forest (Af, ft2), or
Storage volume (ft3) = d(ft) θ Af(ft2) [2]
Runoff volume = Q(in) As(ft2) /12 [3]
Eq [1] says that [2] = [3], so that [dropping dimensions]
dθAf = QAs /12 [4]
and Af/As=Q/12dθ [5]
Direct rainfall: Some of the causative rainfall P falls on the receiving area Af directly. That adds PAf to the inflows. This results in
Af/As=Q/(12dθ-P) [6]
Safety factor: The porosity θ and the depth d are the most naturally varying items here, and a safety factor might be applied, resulting in
Af/As=Q/(12dθ/SF-P) [7]
Equation [7] should be the preferred form. This calculation will dispose of the surface water from the surface, but not retain it all in the receiving profile.
| Symbols | |
| As | Area of source area, ft2 |
| Af | Area of receiving area ft2 |
| θ (theta) | effective porosity as a decimal fraction |
| d | soil depth, ft limited by depth to water table |
| P | Event rainfall, inches |
| Q | Event contributing runoff from As, inches |
| SF | Safety Factor (2) |
Given: A 25.5-acre tract is being considered for development. Due to NJDEP buffer requirements, only 11.5 acres can be developed. Determine how much forested area is needed to handle the stormwater runoff without berming.
100-year event
| Q= | 9.31 | inch of runoff |
| d = | 6 | Feet of depth (above SHWT) |
| SF = | 2 | Safety Factor |
| θ = | 0.4% | Porosity |
| AS = | 11.5 | acres of surface runoff |
| Af = | 21.7 | Area of forest needed |
| P | 9.31 |
Given: Area of forest needed is 21.7 acres for 100-year event which is greater than the entire tract
11.5 + 21.7 = 33.2 acres N.G.
Go to 10-year event
| Q= | 5.41 | inch of runoff |
| d = | 6 | Feet of depth above SWT |
| SF = | 2 | Safety Factor |
| θ = | 0.4% | Porosity |
| AS = | 11.5 | Acre of surface runoff |
| Af | 6.9 | Area of forest needed |
| P | 5.41 | Rainfall |
Given: Area of forest needed is 6.9 acres for a 10-year event.
11.5 + 6.9 = 18.4 acres is less than 25.5 acres, which is the total acreage of the tract
Design Berm to Adjust for Difference in Storm Design
An embankment is needed for difference between 100-year 24 hour and 10-year 24 hour is 9.31 inches – 5.41 inches is 3.9 inches.
Total acre feet of storage needed by berm is 3.9 inches/12 inches/foot X 25.5 acres is 8.3 ac-ft.
Total forest area is 25.5 acres (total area of tract) – 11.5 acres (project) = 14 acres of available forest
(14 acres * Height of Berm) = 8.3 ac-ft
Assuming a slope of 1% of forested area, the difference in elevation from the upper end of the forested area to the lower end is estimated to be 2.5 feet.
Height of Berm is 0.6 feet + 0.5 feet (for settlement) + 2.5 feet = 3.6 feet of berm
Design overflow structure for the proposed berm for the 100-year event
Comparison Summary
| Method | Required Forest Area (Acres) |
| 1. Empirical | 8.3 |
| 2. Conservation of Rate | 8.75 |
| 3. Volume | 6.9 (plus berm) |
Use the more conservative design which is the volume approach with 6.9 acres plus berm.
Commentary
All three methods have advantages and disadvantages in calculating the needed area of forest to receive runoff from impervious surfaces. To fully validate these findings, we recommend a pilot project.
The advantage of using a forested area is to mimic the existing subsurface runoff through the existing infiltration capacity of a forested porous soil profile and to use a living ecosystem to maintain the efficacy of the BMP. This existing hydrology takes days (not hours) to drain to nearby streams or ponds. The proposed design is to take advantage of the infiltrating capabilities of the forested areas and to eventually drain to nearby streams in days (not hours) or to recharge to an underlying aquifer.
Man-made infiltration basins are an attempt to recreate this type of hydrogeology. If it is not broken, don’t try to fix it is the lesson learned here. As previously stated, detention basins take hours (not days) and discharge in an overland runoff fashion. A detention basin will not mimic the existing hydrology, but forested areas will.
Planning and Design Issues
From the planning, design, and operation of a forest area as a stormwater management practice, the following steps and issues need to be considered:
- Delivery of stormwater to a forest area as a recharge point(s). This seems to be well-developed in current practice. However, given the known effects of water moving at depth, delivery to the open forest area should be shallow, low velocity, and dispersed. The designer needs to employ the criteria of the New Jersey Standards for Soil Erosion and Sediment Control Off-Site Stability Standard for discharging onto undisturbed lands. A NJ-DEP Best Management Practice Forebay or Grass Filter Strip would be required for pretreatment prior to discharging into forest areas.
- The ability of the forested site/surfaces to freely accept the runoff waters routed to it, (i.e., infiltration): Based on observations performed during this study period, this does not seem to be a problem. Forested land surfaces show little indication of overland flow or rills.
- Storage and transmission abilities of the subsurface (porosity and transmissivity). Much of this is locally variable and can only be roughly generalized. This includes storage potential limited by depth to groundwater. This would be a major concern in site selection and design. The soil-hydrology properties are not uniform across the sand pines. In addition, the profile porosity alone is only a partial descriptor of the subsurface storage potential and transmission abilities. Planning and design for such facilities would require knowledge of the specific soil series involved; their hydraulic and hydrologic properties, and depth to groundwater.
- There may be unanticipated water quality issues. Deicing salts in runoff from roads and parking lot may raise local groundwater pollution concerns. In particular, local individual water supply wells in the Cohansey could be susceptible.
- The ratio of length and width of area for the point(s) discharge into forest areas need to be established.
- Investigate whether the existing soils are capable to establish a berm to pond water in forested lands
Limitations
- Not to be used in Forest Areas other than with HSG A soils or possibly HSG B.
- Too much impervious cover can negate the Complacent Curve Number Phenomena.
- This practice is not appropriate to be used on the top edge of sandy bluffs such as Crosswicks Creek and other South Jersey streams that are deeply incised with cohesionless soils.
- Not to be used where the loss of life and property are possible. Considerations must be given to the use of a backup embankment as a safety method to protect nearby development(s) against overland flows that might occasionally occur when the soils are saturated or frozen.
Summary and Discussions
- Much of the soil profile porosity volume is simply “flow-through” space, carrying infiltrated waters to the local water table. Only a fraction of total porosity is effective in significantly retaining infiltrated waters. Storm runoff waters superimposed onto the soil profiles with a trend towards a Field Capacity status.
- The profile storage resource is limited locally by depth to groundwater, which varies aerially and seasonally.
- Most of the stream waters in local baseflow (i.e., long-term permanent streamflow) will have been in contact with these soil profiles as it moves through the hydrologic cycle. This may be important in considering some long-term water quality applications.
Recommendations
- Pilot projects to refine design calculations and construction practices.
- Reexamine the methods to calculate the amount of forest area needed.
- Further evaluate the ratio of forest area needed to the amount of impervious surface at existing locations.
- Investigate and develop or refine a hydrologic/hydraulic model to “flood route” the stormwater runoff through the Pinelands type of soil profile which typically includes an irregular surface, covered with forest litter, gently sloped in one or more directions. The model would need to consider the enhanced infiltration that can be achieved due to surface retardance and localized ponding. •
Acknowledgments
Dr. Richard Hawkins, PhD, P.E., Professor Emeritus, University of Arizona
Hunter Birckhead, P.E., Colliers Engineering and Design
Michael Horst, PhD, P.E., Associate Professor of Civil Engineering, The College of New Jersey
William Minervini, NJDEP (retired)
Further Reading
Hawkins, R.H. 1990. Asymptotic Determination of Curve Numbers from Rainfall-Runoff Data. In Watershed Planning and Analysis in Action, (Symposium Proceedings, Durango, Colorado). American Society of Civil Engineers, New York. pp67-76.
Hawkins, R.H. 1990. A Taxonomy of Small Watershed Rainfall-Runoff. Proceedings of the Arizona Nevada Academy of Science, 1990 Phoenix Meeting. 10pp
Kent, K.R. 1973. “A Method for Estimating Volume and rate of runoff in Small Watersheds”. USDA Soil Conservation Service, SCS-TP-149. Revised April 1973. 64pp
Reese, A. J. (2006). “Voodoo hydrology.” Stormwater 7(5), July-Aug 2006. p42
USDA, Soil Conservation Service. (1990). “Estimating runoff for conservation practices.” Engineering Technical Note 210-18-TX5. 47pp.
USDA, Natural Resource Conservation Service. (2003). “National Engineering Handbook, Part 630, Hydrology.” www.wcc.nrcs.usda.gov/hydro/hydro-techref-neh-630.html.
Endnotes
1. USDA, Natural Resources Conservation Service. (1954 et seq). “National Engineering Handbook, Section 4 Hydrology.” ca 400pp. ↩
2. USDA, Soil Conservation Service. (1986). “Urban hydrology for small watersheds”. Technical Release 55, USDA-SCS, Engineering Division. USGPS, Washington DC. ↩
3. Ibid. ↩
4. Hawkins, R.H. (2020). “The Complacent-Violent Response in Applied Hydrology: Application to McDonald Branch, New Jersey Pinelands” Consultant’s report to Maser Engineering, Red Bank, New Jersey. 17pp. ↩
5. See Appendix A: A Review of the 2011 flood at McDonald Branch in Byrne State Forest NJ ↩
6. Hawkins, R.H. (2020). “BMP Planning and Uplands Storage in the New Jersey Pinelands: A Reconnaissance” Consultant’s report to Maser Engineering, Red Bank, New Jersey. 14pp. ↩
7. See Appendix B: Soils Information ↩
8. Handbook for Stormwater Detention Basins, Somerset County, New Jersey. ↩
9. Supra note 2 ↩
10. 1981 February, New Jersey Stormwater Quantity/Quality Management Manual prepared by the Delaware Regional Planning Commission ↩
1. Hawkins, R.H. 1975. The Importance of Accurate Curve Numbers in the Estimation of Storm Runoff. Water Resources Bulletin 11(5). October 1975. ↩
12. New Jersey Pinelands Commission. Comprehensive Management Plan. Adopted November 21, 1980 pp. ↩
13. USDA, Soil Conservation Service. (1954 et seq). “National Engineering Handbook, Section 4 Hydrology.” ca 400pp. ↩
14. Hawkins, R.H., June 2014. Curve Number Method: Time to Think Anew. Journal of Hydrologic Engineering. ASCE June 2014 ↩
15. Hawkins, R.H. T.J. Ward, D.E. Woodward, and J.A. VanMullem. (2009) ASCE/EWRI Task Committee Report on State of the Practice in Curve Number Hydrology. American Society of Civil Engineers Reston VA. ca 106 pp ↩
16. Hawkins, R.H., (Chair), T.J. Ward, (Co-chair), D.E Woodward, (Co-chair), H. Birckhead, J.V. Bonta, D. Frevert, C. Hoeft, R. La Plante; M. E. Meadows, J Miller; S.C. McCutcheon, G. Moglen, D. Powers. J. Ramirez-Avila, E. W. Tollner, J.A.VanMullem. Report of ASCE-ASABE-NRCS Task Group on Curve Number Hydrology, American Society of Civil Engineers, Reston VA. Chapters 8 (Land Use and Land Treatment Classes), 9 (Hydrologic Soil Cover Complexes), 10 (Estimation of Direct Runoff from Storm Rainfall), 12 (Hydrologic Effects of Land Use and Treatment).115pp total. ↩
17. Hawkins, R.H. 1992. Asymptotic Determination of Runoff Curve Numbers. Journal Irrigation and Drainage Engineering, Amer. Soc. Civ Eng., 119(2), March/April 1993, 334-345. ↩
18. Supra note 4 ↩
19. Supra note 6 ↩
20. Hawkins, R.H. T.J. Ward, and D.E. Woodward. 2015. “The Complacent-Violent Runoff Behavior: a Departure from Tradition”. Proceedings ASCE Watershed Management Conference, Reston Virginia, August 2015. 12pp, CD. ↩
21. Supra note 4 ↩