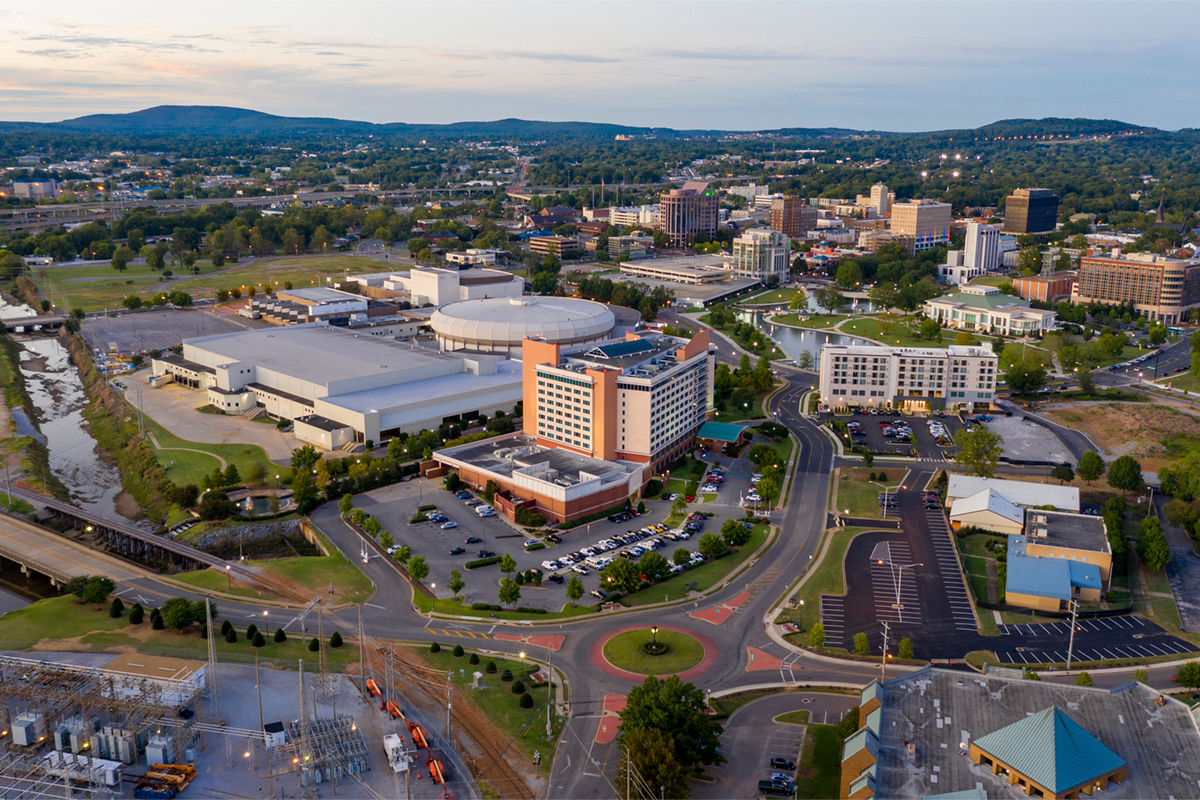
 Huntsville, Alabama. Photo: Real Window Creative/Shutterstock.com
The Residential Real Estate Market and the Pandemic
The first American COVID-19 case was reported on January 21, 2020, in Washington state. Although the media reported the growing threat of the virus throughout the last week in January and throughout February, the declaration of a public health emergency on March 13th by President Trump signaled the widespread health danger to the U.S. population. However, COVID-19 spread differently across the country. While the virus spread quickly throughout cities in the northeast U.S., particularly in New York City, which became the epicenter of the infectious virus, it spread more slowly in other areas.
As the COVID-19 pandemic escalated in spring 2020, many residential buyers escaped from urban areas to less populated suburbs or even rural areas, while others working remotely looked for a larger home with more space and amenities. There was a substantial increase in demand for high-end houses with more space and larger yards in more populated markets with many affluent residents. In less affluent markets, the need was often for less expensive homes that multi-family tenants could afford to purchase. According to the National Association of Realtors, the supply of houses nationwide dwindled to a 1.9-month supply in December 2020 from a high of 4.98-month’s supply in May. Sellers have expressed concerns about possible COVID-19 infected buyers in their residences and the dangers of house hunting themselves, despite the appeal of low mortgage rates. The National Association of Realtors reported that the existing home median price in all metropolitan areas increased from the same quarter the previous year, the first time since 1980.1 The proportion of first-time buyers is lower, and buyers are less likely to be denied credit by lenders, but the median purchase prices have jumped 26% compared to pre-pandemic times.2 The increase in home prices hurt housing affordability, but was partially offset by low mortgage rates that continued to drop throughout 2020; 30-year mortgage rates started 2020 in the mid-3% range and ended the year in the mid-to-upper 2% range.
Interestingly, the pandemic worsened a U.S. housing supply shortage that has grown steadily tighter for many years. In May 2010, the month’s supply of existing homes was almost 12 months. Much of the supply problem can be traced to homeowners choosing to stay put. In 2005, just 8.6% of homeowners stayed 20 years in their houses, but that increased to 25.1% by 2020.3 Also, the average stay increased from 8.7 years in 2010 to 13 years by 2020. The pandemic just exacerbated an already tight housing market.
Although national housing statistics are informative about trends, the effects of supply and demand on housing prices and premiums occur at the local level. Many more rural areas were spared the most devastating effects of the virus until later in 2020. Therefore, the impact on housing supply and demand did not begin to occur until COVID-19 cases began to mount locally. While much media attention has focused on housing prices in hard-hit urban areas in the northeast U.S., the effects of COVID-19 on the prices of houses in other areas are not as well understood. We examine the impact of COVID-19 on the single-family housing market in Huntsville, Alabama, a growing, mid-sized city in the South that is attractive to technology and biomedical firms because of its relatively educated workforce and proximity to NASA and Redstone Arsenal facilities. Professionals leaving urban northeastern U.S. cities often favor Huntsville, Alabama, to other localities because of its technology-driven economy and government infrastructure. Many others are moving to Huntsville as part of a job transfer.4
While no housing market is “typical,” Huntsville is indicative of a less concentrated geographic area with substantial job opportunities and growth. Even after steadily increasing home prices over the last few years, Huntsville and Madison County are still attractive in price compared to many metropolitan areas. The 2019 cost of living index is 84.5 relative to the U.S average of 100, while the December 2020 median cost of a detached house is $258,820.5, 6
The purpose of this research is to examine the effect of the COVID-19 pandemic on the pricing and marketing times of single-family homes in Huntsville and the surrounding area. Homebuyers’ changing needs in the pandemic, such as a greater demand for larger houses with more amenities, complicate the analysis.
Data and Methodology
The U.S. Census Bureau reports that Madison County, Alabama, has a landmass of 802 square miles and a population density of 418 per square mile. The estimated 2019 population is 372,909 for Madison County, and the ethnic composition is 70% white, 25% African American, and 5% Asian and other ethnicities. The county’s adult population is well-educated, with 43% holding a bachelor’s degree or higher; median household income is $65,449.
The principal city in the county is Huntsville, with a 2019 population of 196,219. The town, incorporated in 1811, was the first incorporated city in Alabama. Until 1940 it was primarily a hub for cotton production. At the beginning of World War II, it was chosen as the site for several weapons manufacturing plants. In 1941 Redstone Arsenal opened and served as a center for rocket research and development. Today, the city is known for the NASA Marshall Space Flight Center, the United States Army Aviation and Missile Command, and for its substantial presence in aerospace and military technology. Huntsville, Alabama, is the site of companies such as Boeing, Lockheed Martin, and Collins Aerospace. Huntsville is also the location of the University of Alabama in Huntsville, with approximately 10,000 students, and Alabama A&M University with over 6,000 students.
The single-family housing data for analysis of pricing and time-on-the-market was obtained from the North Alabama Multiple Listing Service, which serves several counties in North Alabama, including Madison County. The selling transactions for this study included the Huntsville metropolitan area and surrounding communities in Madison County. A sample of 1,117 completed transactions in 2020 serves as the sample of interest during the COVID-19 pandemic. The larger sample of 46,668 properties from 1996 – 2020 is used for estimating price premiums, as a base of transactions outside the pandemic window is needed to model the estimated price.7 Figure 1 reports the descriptive statistics of the sample.
Figure 1: Descriptive Statistics
| 1996 – 2020 | 2020 | |||
| Variable | Average | Std. Dev. | Average | Std. Dev. |
| Final listing Price (LP) | $197,357 | $120,997 | $297,012 | $173,926 |
| Selling Price (SP) | $193,618 | $116,916 | $294,266 | $164,733 |
| Square Feet | 2,210 | 879 | 2,535 | 1,033 |
| House Age (Years) | 11 | 16 | 23 | 21 |
| Price/Sq. Ft. | $84 | $23 | $115 | $27 |
| Discount from Final LP | 1.83% | 4.17% | 0.39% | 4.38% |
| Days on Market | 110 | 126 | 43 | 89 |
| N = | 46,668 | 1,117 | ||
The average size of a house sold in 2020 is 2,535 square feet, which is almost 15% larger than the 25-year average. The average discount from the listing price is about 0.4% in 2020 compared to 1.83% for the long-term average. The average of 43 days-on-the-market (DOM) in 2020 is 61% lower than the 25-year average. The small discount from the final listing price and considerably shorter DOM indicate a tight housing supply in the Huntsville market.
COVID-19 Infection and Home Price Escalation
Residential selling price changes because of COVID-19 may occur because of perceived and actual events that change sellers’ and buyers’ behavior in the market. The perceptions of market participants begin to change when news and rumors circulate about COVID-19, however, residents in areas not directly impacted yet by the virus may not change their behavior until the effects are localized and present a direct health threat. In Madison County, Alabama, the first documented COVID-19 case occurred on March 17th, and the first death occurred 11 days later, on March 28th. However, the rapid increase started in mid-July, as shown in Figure 2.
Figure 2: COVID-19 Cases and Deaths in Madison County, Alabama
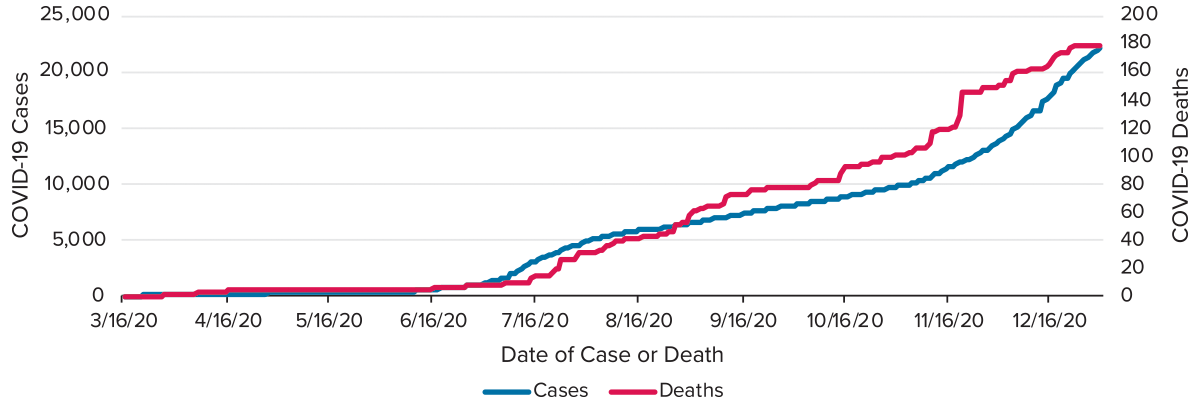
On July 15th there were 2,942 cases but only 13 deaths. By the end of 2020, more than 22,197 cases and 178 deaths were recorded in the county.
The price per square foot of existing family homes increased from about $106 in January/February to $118 in November/December as shown in Figure 3.
Figure 3: Price Per Square Foot for Single-Family Houses in Madison County, Alabama (2020)
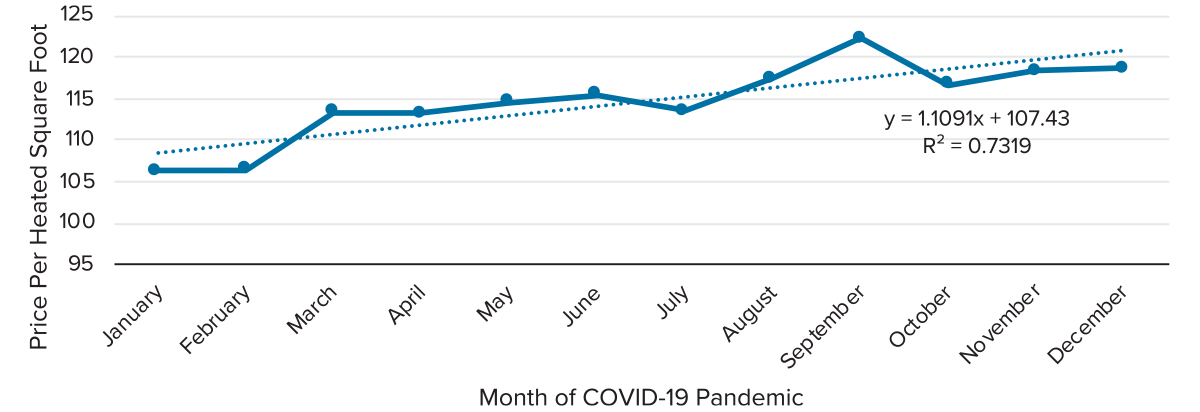
After the initial jump of $6.74 from February to March, the price per square foot remained relatively unchanged until July. By August, it increased and remained elevated throughout 2020. The trendline indicates an average increase of $1.11 per month. The most likely cause for the rapid increase in housing prices is the sharp decrease in the supply of houses for sale without a corresponding drop in demand. The Alabama Center for Real Estate estimates that the months of supply (MOS) of single-family houses declined by 50% during 2020.8
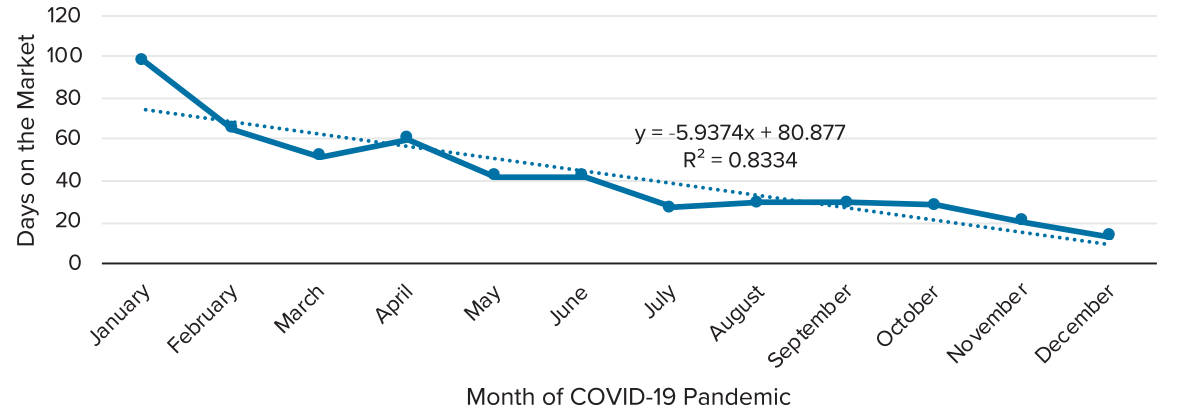
A decline in MOS of single-family houses should affect the days-on-the-market (DOM) of houses purchased. Figure 1 shows that long-term DOM has been 110 days, but it dropped to an average of 43 days in 2020. Figure 4 shows that the January 2020 DOM was about 98 days in a by-month analysis, but that it decreased to just 13 days by December or an average decline of 6 days per month.
Figure 4: Days on the Market for Single-Family Houses in Madison County, Alabama (2020)
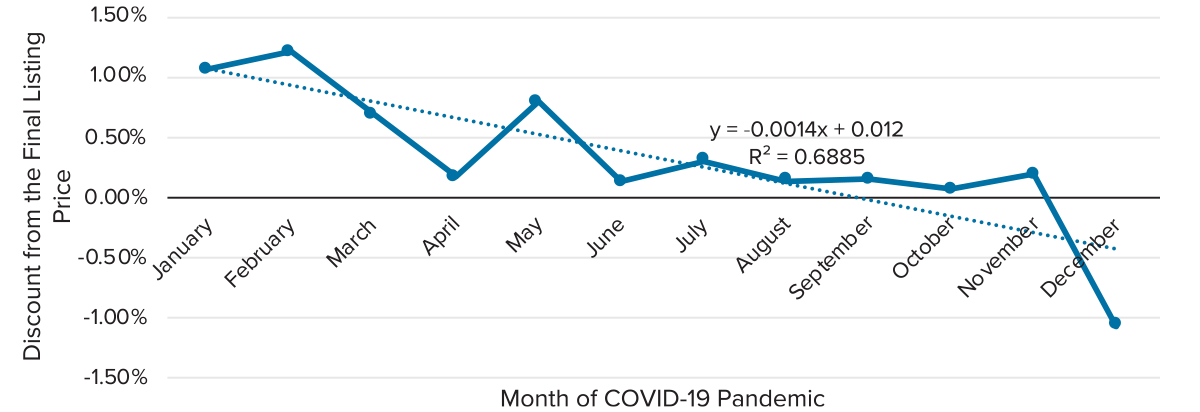
The drop in the supply of houses also had a significant effect on pricing. The historical average discount from the final listing price was 1.83%, as shown in Figure 1. Figure 5 indicates that the discount remained above 1% in January and February but declined rapidly by about 0.14% per month. By December, the discount was -1.06%, indicating that buyers were paying 1.06% above the final listing price to buy a house.
Figure 5: Discount from the Final Listing Price for Single-Family Houses in Madison County, Alabama (2020)
Listing and Selling House Premiums
The housing supply shortage caused sellers to increase their listing prices and selling prices compared to prices in the pre-pandemic era. Price premiums can be estimated using a hedonic regression model. Price premiums are defined as the percentage difference between the actual and expected prices. The hedonic regression premiums are calculated from single-family property data in the Huntsville, Alabama, metro area from 1996 -2020 with controls for property characteristics, location, occupancy, financing, and time effects.9 Figure 6 shows the listing and the selling price premiums.
Figure 6: Estimated Price Premiums in Madison County, Alabama, during COVID-19 Pandemic
| COVID-19 Month | Listing Price Premium |
Selling Price Premium |
Difference SPP – LPP |
| February | 3.63% | 3.79% | 0.16% |
| March | 4.9%** | 5.41%** | 0.51% |
| April | 4.43% | 5.32% | 0.89% |
| May | 5.25%* | 5.31%** | 0.05% |
| June | 2.68% | 3.34%*** | 0.66% |
| July | 5.44%* | 6.56%*** | 1.12% |
| August | 7%** | 7.75%*** | 0.75% |
| September | 9.69%*** | 10.78%*** | 1.09% |
| October | 9.18%** | 10.57%*** | 1.40% |
| November | 8.82%*** | 9.59%*** | 0.77% |
| December | 12.6%*** | 15.38%*** | 2.78% |
*Statistically significant at the 10% level
**Statistically significant at the 5% level
***Statistically significant at the 1% level
Listing prices had already been higher in recent years because of the decrease in MOS of existing houses and the increasing demand as more people moved into the Huntsville area to take advantage of job opportunities and a moderate cost of living. However, listing price premiums were between 2.7% to 5.3% through June 2020 but increased to 12.6% by December. Likewise, selling price premiums averaged 3.3% to 5.4% in the first half of 2020 but were as high as 15.4% in December 2020. Figure 7 shows a graph of listing and selling price premiums. A clear divergence of the two premiums starts in July.
The premium differential was 0.45% from February to June 2020, and it increased to 1.32% in the last half of 2020. The results indicate that sellers not only elevated their listing prices over the year but that selling price premiums were increasing more rapidly than listing price premiums. Sellers were raising their prices significantly and buyers were more than willing to pay the higher prices. Figure 8 compares selling price premiums in the last three quarters of 2020.10
Figure 8: House Size and Estimated Selling Price Premiums in COVID-19 Pandemic
| House Square Feet (Percentile) | |||
| Quarter in 2020 | 1,558 (25%) | 2,010 (50%) | 2,686 (75%) |
| April – June | 7.12%** | 4.47%** | 0.49% |
| July – September | 13.39%*** | 9.64%*** | 4.04% ** |
| October – December | 17.44%*** | 12.31%*** | 4.63%*** |
Note: Percentiles are based on the 1996 – 2020 sample.
**Statistically significant at the 5% level;
***Statistically significant at the 1% level.
The findings indicate that the percentage change in house prices decreased with size, with property price changes in the 25th percentile outperforming those at the median, and the prices of properties at the 25th and 50th percentile increasing more rapidly than those at the 75th percentile. One reason may be that potential homebuyers were escaping from multifamily housing; many with limited income would seek more affordable smaller houses. The affordability of single-family homes decreased because prices escalated rapidly as the pandemic worsened, resulting in less affordability and more demand for lower-priced houses.
Implications
The analysis shows that a dramatic decrease in the housing supply led to shortages of available single-family housing. The shortage resulted in decreased time on the market for available houses and higher selling prices per square foot. The pandemic has also resulted in smaller discounts from the listing price and higher listing and selling price premiums than the pre-pandemic period. Buyers who want to move from multifamily housing to single-family housing to reduce their susceptibility to infection from the virus, or others who wanted more space to work from home, and for their children to learn from home, had to pay sellers a price premium of as much as 15%. The premium compensated sellers for the potential health risks associated with allowing potentially infected buyers to be inside their homes and the cost of finding another residence in an ultra-competitive housing market. The premium was larger for smaller houses, presumably because of a greater increase in demand from multi-family residents seeking single-family housing that was still affordable. The more substantial increase in house prices at the lower end of the Huntsville single-family housing market is contrary to what has been reported in metro markets such as in Northern California and the suburbs of New York City where prices escalated more quickly.11 The current wave of price premiums is unlikely to continue after COVID-19 recedes, although home buyers will probably not revert completely to a pre-COVID-19 mindset.12 The movement towards working remotely and online shopping growth make less densely populated areas in the South and Southwest more attractive since social distancing outside can occur virtually all year, and population density levels are lower.13 Huntsville, Alabama, and places like it offer all these advantages and a lower cost of living too, and it is possible that this migration trend will continue. •
Do you disagree with the author’s conclusion? Have a different opinion or point of view? Please share your thoughts with REI, or better yet prepare and submit a manuscript for publication by emailing the Real Estate Issues Executive Editor (or Board) on this article to rei@cre.org.
Endnotes
1. The Wall Street Journal, “Home Prices Are Rising Everywhere in the U.S.” 2020, See https://www.wsj.com/articles/home-prices-are-rising-everywhere-in-the-u-s-11605220823. ↩
2. The Wall Street Journal, “See Pandemic Boosts Upper End of Housing Market Coast to Coast” 2020, See https://www.wsj.com/articles/pandemic-boosts-upper-end-of-housing-market-coast-to-coast-11605106801. ↩
3. The Wall Street Journal, “Housing Market Stays Tight as Homeowners Stay Put” 2020, https://www.wsj.com/articles/housing-market-stays-tight-as-homeowners-stay-put-11611226802. ↩
4. Huntsville is currently undergoing a period of rapid growth. The Federal Bureau of Investigation is constructing a $1 billion “HQ2” in Huntsville to accommodate 1,400 additional employees that will be transferred from Washington, D.C., and for another 4,000 local jobs that are expected to be created in the next decade. Facebook and Google have created new facilities in the area. Blue Origin and Aerojet Rocketdyne have new rocket motor manufacturing facilities, BOCAR opened a new auto parts plant, and LG opened a new solar module assembly plant. Mazda-Toyota is building a $2.31 billion manufacturing facility employing 4,000 people just five miles from the Madison County line. The plant will become operational in spring 2021 GE Aviation, BAE Systems, Polaris and others have also opened or enlarged facilities. Because of the local economy’s strength, many new multi-family and single-family communities have been built based on developers’ expectations that increased employment in the Huntsville area will be permanent and that growth will continue. ↩
5. See https://www.city-data.com/county/Madison_County-AL.html. ↩
6. See https://www.redfin.com/county/163/AL/Madison-County/housing-market. ↩
7. The first transaction begins on 9/16/1996 and the last ends on 12/11/2020. ↩
8. See https://www.acre.culverhouse.ua.edu/. The decline already started in 2014 when 8.3 MOS was available. But December 2017 MOS was only 1.5 months followed by 0.9 months in December 2020. ↩
9. The Appendix shows variables and coefficients in the listing and selling price regression models. ↩
10. The selling price premiums are estimated from the hedonic pricing model by including an interaction of the quarter in 2020 with house square feet. The first quarter of 2020 is the omitted holdout period. ↩
11. The Wall Street Journal, “See Pandemic Boosts Upper End of Housing Market Coast to Coast” 2020, See https://www.wsj.com/articles/pandemic-boosts-upper-end-of-housing-market-coast-to-coast-11605106801. ↩
12. The Wall Street Journal, “When the Coronavirus Pandemic Settles Down, so Will Homeowners” 2020, See https://www.wsj.com/articles/when-the-coronavirus-pandemic-settles-down-so-will-homeowners-11606222802. ↩
13. Forbes, “COVID-19 Has Changed The Housing Market Forever. Here’s Where Americans Are Moving (And Why)” 2020, See https://www.forbes.com/sites/petertaylor/2020/10/11/covid-19-has-changed-the-housing-market-forever-heres-where-americans-are-moving-and-why/. ↩