 June 7, 2020, Brazil. 2021 United Nations Climate Change Conference (COP26) appears on a flag. Photo: rafapress/Shutterstock.com
Introduction: Heatwaves and Net-Zero Commitments Capture Headlines
With the UN Climate Change Conference (COP26) less than one month away, there has been an increasing momentum around net-zero carbon commitments.1 In fact, the UN’s Race To Zero now represents over 120 countries, 700 cities, 2,300 businesses, 160 institutional investors and 600 universities committed to achieving net-zero carbon emissions by 2050 at the latest. Collectively, these actors now cover nearly 25% of global CO2 emissions and over 50% of global GDP. In real estate, institutional investors and listed REITs have been leaders in announcing their net-zero commitments. These commitments will require investments in building retrofits and switches to renewable energy sources. New types of reporting for energy use and carbon emission as well as technological innovations allow us to keep track of meeting these targets. Innovation in our fragmented industry dominated by long-lasting legacy assets might require extra efforts. Investors in European real estate will be forced to step up to the next level when EU and local regulators set more aggressive targets for renewable energy use and carbon emission reductions. Together with the latest news on continued and worsening heatwaves in the Western US and Canada, climate change has moved to the top of the agenda for many investors. In this review, we quantify the impact of climate change on European real estate returns over the next 20 years. It considers transition and physical climate risks as well as a new macroeconomic climate perspective. This type of analysis does require some brave assumptions along the way, which we highlight together with the results.
Better GDP Growth in Next 10 Years in Orderly Climate Transition
To better understand the possible impact of climate change on the economy, we focus on three economic climate change informed projections from Ortec Finance. First of all, the Paris orderly transition scenario which shows a positive economic impact on European GDP growth in the next 10 years, relative to the climate un-informed baseline scenario. The baseline is similar to consensus forecast. The positive impact comes mostly from increases in public and private investments needed to meet the Paris accord objectives. Secondly, the failed transition scenario which assumes that no further policy initiatives are launched to meet climate targets. Despite little immediate impact, temperatures will rise more and sooner with an immediate negative impact on the economy. Finally, the disorderly transition scenario which reflects the real-world political difficulties coordinating climate policies globally. Ultimately, the macroeconomic impact is in line with the orderly transition.
Figure 1: Climate scenario impact on baseline GDP growth forecast
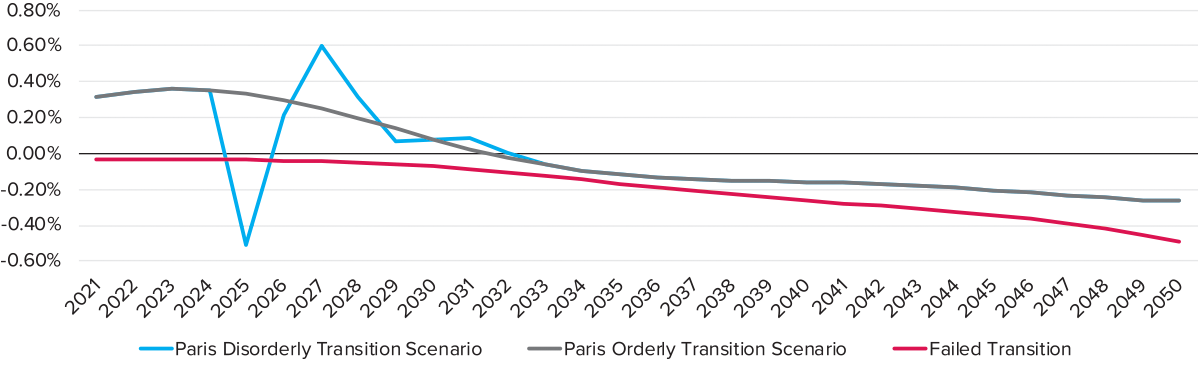
Sources: Ortec Finance, AEW Research & Strategy
Policies for an orderly transition make good economic sense for Europe, based on cumulative GDP growth impacts over the next 30 years showing that it limits the impact from climate change to less than 1% cumulative in both the orderly and disorderly transition. However, doing nothing to meet the Paris accord as shown by the failed transition confirms that it is an economically unattractive option as GDP would be nearly 6% lower over the next 30 years. This equates to a staggering amount of US$ 1.7 trillion as the estimated difference in GDP growth over the 2021-50 period between the orderly and failed transition. This is for Europe alone and it would be reasonable to expect a similar, if not greater impact for the US.
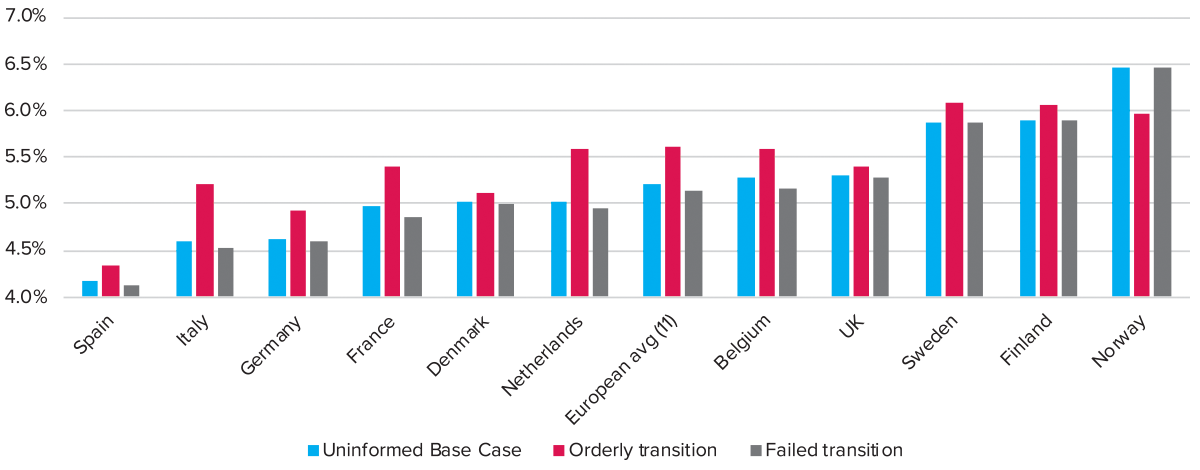
The European average for the economic growth benefits from an orderly transition hides big differences between countries. Apart from the short-term boost from investment in 2021-30, later periods show increasingly negative results, as transition-related investments need to be repaid. The 2041-50 period has more than twice the negative impact as in 2031-40. Data in Figure 2 shows countries sorted from best to worst cumulative 2021-50 GDP impact with Norway standing out. Its reliance on oil and gas exports makes it the biggest economic loser in all periods. Geographically similar Finland is expected to benefit most as climate change will allow for longer growing seasons boosting the economy.
Figure 2: Cumulative GDP impact for orderly transition scenario per country (2020-2050)
![]()
Sources: Ortec Finance, AEW Research & Strategy
Thanks to its more developed low-carbon energy sector, Spain stands out as having a small positive GDP impact for the next 30 years, especially compared to Italy. As a result, Italy has a higher initial required investment positively impacting economic growth. But as investment slows down, growth loses its momentum with the debt repayment starting, income and consumption fall. Each country’s status of already implemented policies determines the needed transition investment and the associated economic boost.
Positive Real Estate Return Impact from GDP Reverses After 2030
As a result of the improved GDP growth, 2021-30 returns improve by approximately 40 bps pa (basis points per annum, from 5.2% to 5.6%) across all European property markets in an orderly transition compared to our climate uninformed Apr-21 base case. As discussed earlier, this is driven by the better GDP growth expected in an orderly transition. With the exception of Norway, all national average returns improve as a result of the transition induced stronger economic growth. Dutch and Italian markets are forecast to show 60 bps pa improvements in returns, while the UK and Denmark are predicted to have only 10 bps pa additional returns. Our impact analyses are based on the same sensitivity of GDP to total returns as implied by the scenario analyses in our mid-year 2020 outlook. It should be noted that there was no difference in bond yields between our April 2021 base case and the orderly transition scenario. But, as the investment-driven macroeconomic boom in the 2021-30 period ends, the impacts from debt servicing and other effects are coming to the forefront in the next 10-year period. Norway again stands out with a negative impact from an orderly transition. Instead of a positive 40 bps positive impact on real estate returns, we see a small negative 10 bps and 20 bps average impact from the expected decline in GDP in an orderly and failed transition scenario, respectively. Our results show that Finland and Spain have a positive impact from an orderly transition. The UK has the smallest impact from either an orderly or failed transition.
Transition Risk Focuses on Energy Reduction Costs
Climate-related transition risks focus on measuring climate change mitigation, which include regulatory risks such as energy and greenhouse gas (GHG) reduction requirements. Market expectations, technological and reputational changes are also considered. Not meeting regulatory requirements can make an asset “stranded” and unable to generate revenues.
Figure 3: Total return forecasts per climate scenario and country for 2021-2030
Sources: Ortec Finance, AEW Research & Strategy
Upcoming energy and GHG reduction regulatory targets are likely to result in a shift in focus from current building certifications towards a more climate risk focus approach to be achieved. The Carbon Risk Real Estate Monitor (CRREM) allows for a top-down market-level cost assessment to meet specific Paris-accord-informed carbon reduction and energy intensity pathways for commercial and residential real estate properties based on their country and property type. Historical building retrofit data identifying their actual costs and achieved energy intensity reductions is the basis for assessing the costs of energy reduction. A 15% reduction in energy for a building costs EUR 60 per sqm in 2010. However, these costs do not increase linear, as it becomes more costly and more difficult to reduce energy intensity by 100%. The closer to full energy reduction as % of the targeted pathway, the higher the costs. For a 95% reduction, the costs in 2010 were estimated at EUR 580 per sqm based on data from the DEEP retrofit database.
Future Cost Savings Are Part of Our Five-Step Approach
Consistent with other areas of renewable energy like solar and wind, technological advances have in the past helped reduce costs in many different ways. The CRREM assessments assume that cost savings will be realized in the future due to technological innovations when retrofits are needed to reduce the energy intensity of commercial buildings. It seems logical that PropTech start-ups will focus on achieving efficiency savings where the incremental costs are currently the highest. This is good news for property investors as the future cost savings from technology improvements to achieve near 100% energy intensity are projected to be the highest. The highest category of energy intensity to 95% is expected to reduce in costs four times at 4% pa compared to the lowest energy intensity reduction at only 1% pa. As a result, the potential cost reductions will be most significant for the largest reductions in energy intensity.
In fact, the combination of the non-linear shape of current costs and assumed future costs savings means that investors’ costs of required reductions in energy intensity will be in a much narrower range by 2040 and 2050. By 2050, a 95% reduction in intensity is projected to cost less than EUR 155 per sqm or about the same as the 45% reduction would cost in 2020. In other words, investors are assumed to get 50% energy reduction in 30 years for the same costs as of today.
As shown in Figure 4, this reduces the economic burden on investors and others in the market to meet these carbon and energy intensity pathways. However, it is important to note that it might be unwise to wait till 2050 to make any changes and meet the carbon pathway targets. Market prices will likely reflect new policy initiatives, like subsidies or carbon penalties along the way. CRREM allows for these as well. In order to assess the impact on real estate returns it is important to note that timing matters, especially with longer-term investment horizons of 5-15 years.
Figure 4: Projected annual reduction rate from the average total project cost (EUR/m2) over time per reduction target (xx%)
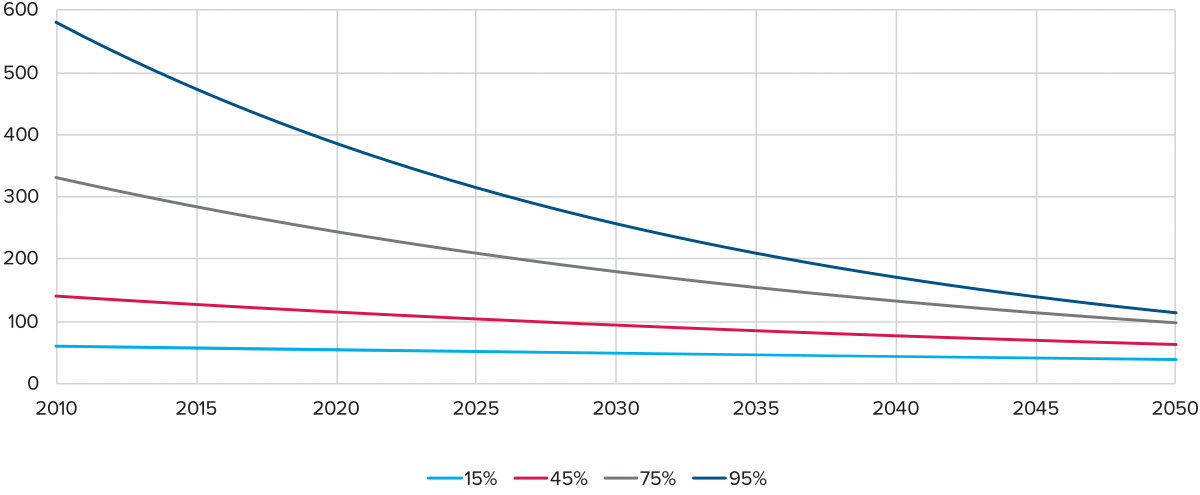
Sources: BPIE, CRREM, AEW Research & Strategy
To reflect all these subtleties in the CRREM data and assumptions, we apply a five-step approach in order to arrive at a relative cost measure of energy intensity transition:
- Look up the % energy intensity reduction needed in KwH per sqm from the freely available pre-filled CRREM tool for each country’s three property sectors;
- Determine the national sector-specific construction costs index from the same tool;
- Calculate the annual costs in Euros per sqm to meet the 2020-40 energy intensity reduction (taking into account the % needed (step 1) and the change in costs over time);
- Determine the average sales price per sqm for each country’s property sector over the 2019-2021 period from the RCA data;
- Calculate the annual energy intensity reduction costs to meet the Paris-accord-based CRREM pathways as % of current property price for each country’s three sectors.
Climate Transition Costs at 44 BPS PA Across All Sectors
Based on our five-step approach, European average climate transition costs are 44 bps pa across all property types. Logistics are estimated at over 60 bps pa, which is more than double the near 30 bps for offices. This is more driven by the lower average price per sqm for logistics compared to offices than the % of energy intensity that needs to be dealt with over the holding period.
Figure 5: Annual 2021-30 Costs of Energy Reduction as % of Price per sqm per property type (European average)
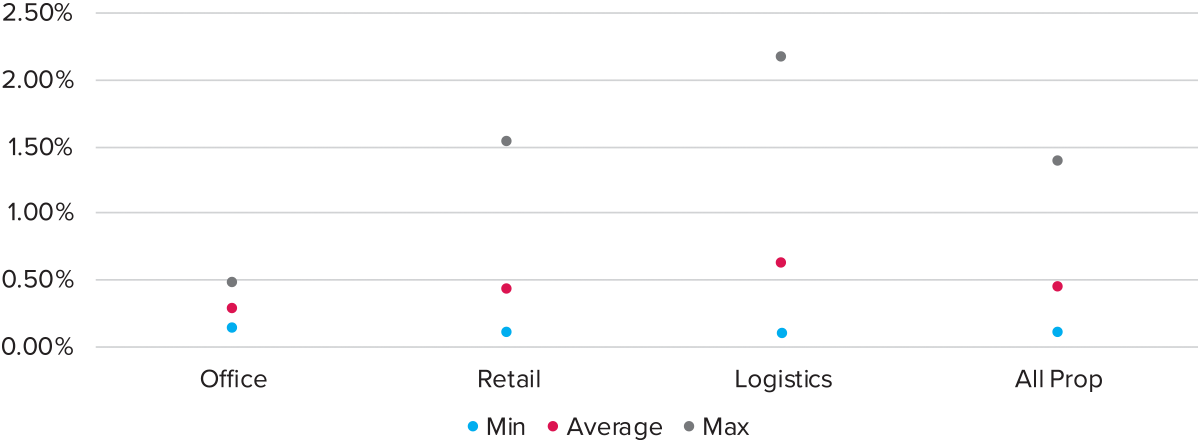
Sources: CRREM, constructioncosts.eu, RCA, AEW Research & Strategy
The spread for individual countries around the European average for the office sector is much smaller than in both logistics and retail. Again this more driven by the difference in the average prices. Luxembourg records the lowest logistics and office premium, while France has the lowest retail transition risk premium. Sweden stands out as highest in offices and retail while Denmark comes top for logistics’ transition risk premium.
Physical Climate Hazard Measurement
In this third section, we discuss physical climate hazards based on data from Munich Re, which prices risks on a wide range of different reinsurance policies for their clients. Based on their natural catastrophe risk models and historical claims experience, Munich Re quantifies future climate hazards under various RCP scenarios. Since Europe is not subject to tropical cyclones, this acute climate hazard is measured — but has a zero probability of occurrence. Sea level rise measurements are already in place, but since data on man-made defenses against sea level rises are not yet uniformly available across Europe full projections are not yet available. Data for five key European cities (Paris, London, Berlin, Madrid and Amsterdam) for both RCP 4.5 and RCP 8.5 scenarios for all four chronic hazards and the acute river flood risk was made available. To increase our accuracy, only the most actively traded and highest average priced office, retail and logistics investment markets were identified in each city. Also, we are only to measure the river flood risk and have disregarded other physical climate risks due to lack of data.
River Flood Hazard Costs of 3 bps pa Across Five Cities
Based on our approach, the area-weighted probability of annual flood occurrence is calculated using the estimated return period (0, 100 and 500 where 100 means once every 100 years) and the share of each sub-market area covered by each return period. The current average annual probability of river flood across our five cities is around 0.19%. This means that 0.19% of the covered market areas is flooded once a year. This is expected to increase by 2050 to 0.20% and 0.22% in the RCP 4.5 and RCP 8.5 scenarios, respectively. The increase in the annual probability over the next 30 years is largest in Berlin and Madrid due to local climate circumstances. Despite showing the highest current annual probability of the river flood in Paris, it is not expected to increase further.
Figure 6: Area weighted probability of annual flood occurrence by city (average) and RCP 4.5/8.5 2050 scenario vs current (%)
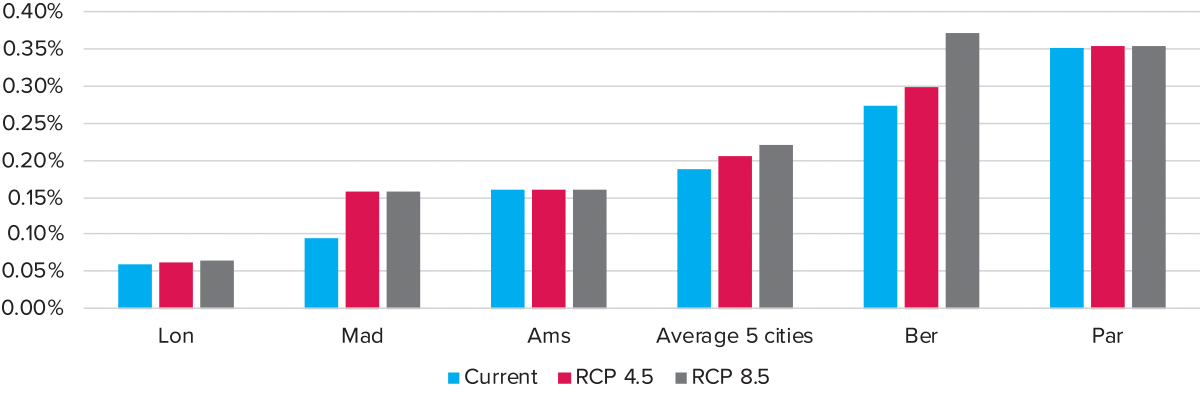
Sources: Munich Re, RCA, AEW Research & Strategy
On the other extreme, the annual probability of river flood in London is lowest and not projected to change much. Despite its below-sea-level location, its advanced flood management systems leave Amsterdam with low and virtually no increase in river flood annual probability, irrespective of RCP.
Our river flood physical risk premium for each market is calculated based on Munich RE’s climate-induced increase of insurance costs. As shown, the results indicate that the premium varies widely across sectors and cities for our 20 market segments across our five cities. In fact, 10 of our 20 segments show a zero risk premium, since they show no increase in their risk of river flooding, with another 4 segments at below 15bp increase. When looking across the sectors we observe that for the office sector the range is smaller than for the other sectors. For the retail sector, the risk premium ranges from o to 21bps per annum. Please note that river flood risk is directly tied to location and the definition of the sub-market, not the property type. In fact, across our universe, the average increase insurance cost is calculated as 31 bps for a 10-year holding period. This means that across our 20 markets sample a 3 bps annual river flood risk premium applies, as shown in Figure 7.
Figure 7: River-flood risk premium per property types (bps)
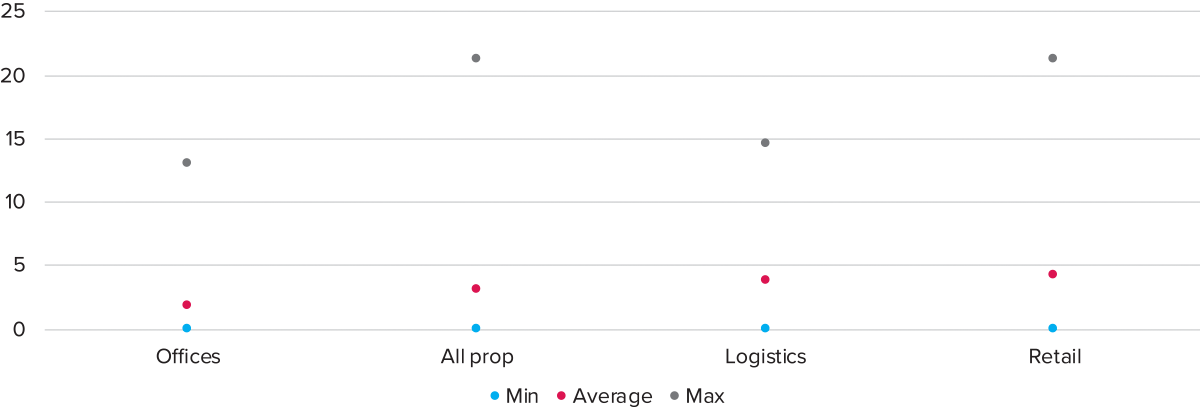
Sources: Munich Re, RCA, AEW Research & Strategy
In our last step, we investigated the impact of chronic climate risk hazards occurring based the RCP 4.5 scenario to 2050. We did this by comparing the change in the underlying scores of the hazards.
On average, the score across all the five hazards is projected to increase 21% to 2050 from its current level. The drought stress is expected, based on the RCP 4.5 scenario, to see the largest increase in the score at just below 35%. On the other hand, precipitation stress is expected to see lowest increase at around 8% from its current level. However, based on Munich Re’s experience, they are not seeing the same degree of potential damage on buildings from these other climate-linked hazards when compared with river flooding. This also limits their ability to incorporate the non-river flood hazard effects into increases in insurance costs. In future work we would like to incorporate these chronic climate-related hazards into our risk-adjusted return framework. However, for the moment the available data doesn’t allow this yet.
Conclusion: European Climate Impact Is -7 BPS PA in 2021-30 and -57 BPS PA in 2031-40
The headline result is that over the next ten years, investors in European real estate should expect a net negative climate impact of -7 bps pa, while from 2031-40, this negative effect ramps up to -57 bps pa. Across all three climate impacts, the same time horizon is used as well as similar climate change scenario assumptions. Our approach allows us to quantify more precise impacts on either a country or city level for each of the three main property types. If we highlight the key conclusions for each of the three climate impacts, we highlight:
- First, the good news, a cumulative +3% GDP 2021-30 growth is projected assuming an orderly transition to implement the Paris-accord climate targets. This lifts 2021-30 real estate returns by 40 bps pa from our climate uninformed base-case forecasts.
- Based on Ortec Finance projections under the orderly transition, the positive effects of climate investments reverse to a GDP decline after 2030. As a result, real estate returns are projected to decline by 10 bps over the 2031-40 period.
- Second, a negative 44 bps impact on 2021-30 real estate returns is expected from climate-related transition risks. The same impact is assumed for 2031-40. These estimated risk premiums are based on the projected costs of carbon intensity reductions for existing buildings as specified for each CRREM sector and country.
- Thirdly, physical river flood risk reduces returns by 3 bps pa over the 2021-40 period. This risk premium is based on Munich Re insurance costs from river flooding under the RCP 4.5 scenario for the 20 most liquid markets across five key capital cities. •
Figure 8: Climate change impact on European real estate returns per period (bps pa) under orderly transition (RCP 4.5)
![]()
Sources: AEW Research & Strategy, Ortec Finance, CRREM, Munich RE, RCA, DEEP, CBRE, ECC
Endnotes
1. Since this article was written, the following report was issued:
Greg Ip. “IPCC Climate Change Report Shows Less Cause for Panic-But More Urgency to Act.” Wall Street Journal, August 11, 2021.
https://www.wsj.com/articles/ipcc-climate-change-report-gives-a-less-extreme-but-more-sobering-outlook-11628697997 ↩