 @NESPIX/shutterstock.com
Update on Top Ten Issue #9 “The Price is Wrong? Do Markets Need a Reset for Values to Normalize?
There is a consensus that property values have passed their peak. Since the peak, owners and valuers of private real estate have faced challenges in determining market value. Real estate is by nature a much less liquid asset class than continually traded stocks, bonds, and other assets with access to public markets. In spite of this relative illiquidity, in most periods there are adequate transactions to provide credible valuations. However, in times when private real estate suffers increased illiquidity, market value becomes more subjective. This article is written with the intent to describe the path of market values in a relatively liquid market post-COVID to a much less liquid market as interest rates increased in 2022. The focus on the more recent, and less liquid, market conditions will provide some insight as where values currently lie, and how close values are to the bottom of the current real estate cycle.
It is a basic fact that if the cost of capital increases, cap rates should increase and property values should decrease, all other factors being equal. However, the pricing reset the market expected in 2022 and 2023 as a result of significantly higher mortgage rates was slow to materialize given the relative freeze in the transaction market with limited reliable sale comparables. Although transaction activity has increased in recent months, some market participants have not recognized the value declines based on observation of a widening spread in prices between valuations and transactions. Even more pronounced is the spread between the better and poorer quality assets. Just as a rising tide raises all ships, a receding tide leaves some ships grounded.
The reality is that CRE markets have moved past peak prices for this cycle and have been declining due to higher interest rates, and in most sectors, slower growth. For reference, the peak of the market is considered as March 2022 by Green Street. NCREIF (National Council of Real Estate Investment Fiduciaries), whose property index includes over 10,000 properties primarily owned by pension funds and investment managers, reveals that the leading property types peaked in 2Q22. The big question is when and where prices are going to hit the bottom of this cycle. To understand the current cycle, it is helpful to analyze several factors that have slowed price discovery. A key hurdle is that buyers and sellers have been in a stand-off. Sellers have held out for values at or close to what was achievable prior to the interest rate explosion in 2022. Meanwhile, buyers are offering much lower prices based on higher financing costs, along with weaker growth expectations.
Although there is general acceptance that prices have dropped, there is less willingness by some owners to accept those write-downs in values. Owners are opting to hold rather than sell in a market with declining prices. This creates a bit of a Catch 22 and a big barrier to assessing true market value. The combination of limited sales with motivated sellers being the primary sellers near the bottom of the market has resulted in transactions that tend to support “market prices” at a low level. Something needs to give in order to close the gap between buyers and sellers and stimulate transaction activity. To stimulate sales activity, either prices need to drop, interest rates need to decline, or perhaps it will be a combination of the two. The following narrative examines the causes and impact of limited transactions, but also offers some insight into where market values are trending.
Lending Rates on the Rise
A bellwether for asset repricing is interest rates and capital costs. Real estate is known for being a highly leveraged asset class, with equity returns enhanced by debt that creates positive leverage. The US Federal Reserve began increasing the federal funds rate in March 2022 with a 25-basis point increase to slow inflation. It was the first of 11 consecutive rate increases that pushed the rate from just over 0.2% in March 2022 to 5.3% in July 2023, where it has remained into early 2024.
Most real estate analysts use a 10-year holding period for valuing real estate by the discounted cash flow method, using the comparable term 10-year US Treasury (UST) rate as a benchmark. This benchmark is adjusted for the additional risk of real estate by applying a spread. The UST rate increased from 2.1% at the time of the first federal funds increase in March 2022 to a high of 4.8% in October 2023. In a reversal of this increasing trend, the UST rate actually declined from 4.0% in October 2022 to 3.5% in April 2023 as the fight against inflation gained momentum. Inflation fell from 7.7% to 4.9% year-over-year during this period. After April 2023 the 10-year rate began increasing once again, in spite of dropping inflation. This increase was a response to tightening credit markets as the federal funds rate continued to increase. The following table illustrates the average quarterly lending rates for the 10-year UST, federal funds, and commercial properties since the first quarter of 2022.
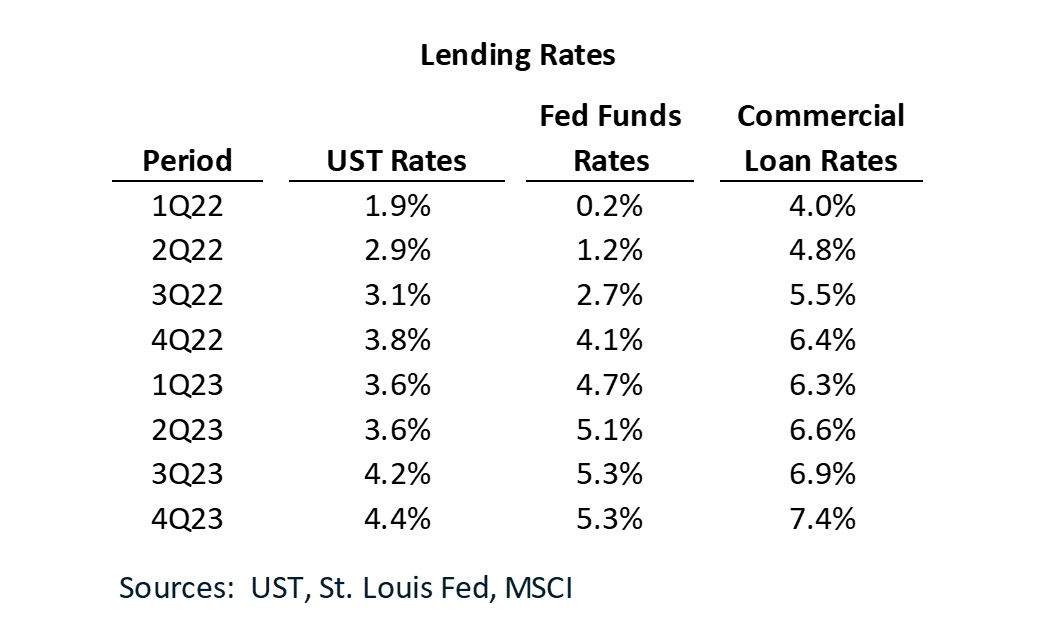
The increasing US Treasury and federal funds rates adversely impacted commercial mortgage lending rates. MSCI reported commercial lending rates increased from 4.2% to 7.3% during the March 2022 through October 2023 period, increasing annual costs for a $100 million loan (30-year amortization) from $5.9 million to $8.2 million, or a $2.3 million increase. This increase had a chilling effect on values, though the dearth of transactions resulted in limited price discovery. Determining market value became a more subjective exercise with a less transparent transaction environment.
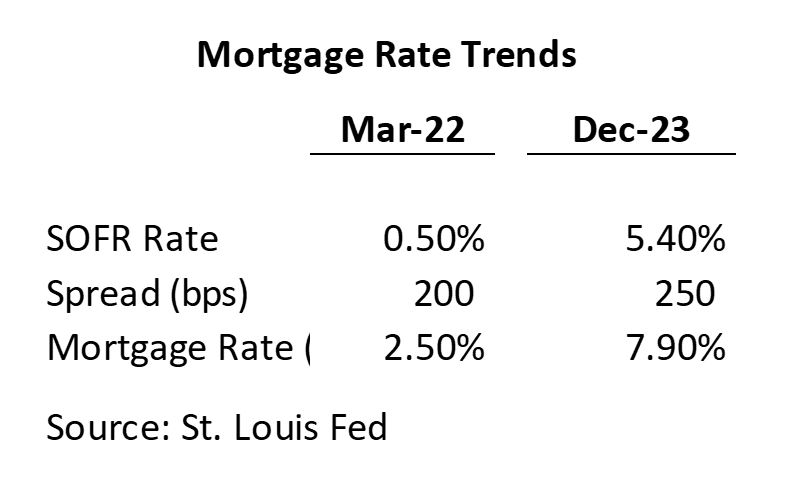
More lenders during the period of rapidly rising interest rates preferred floating rate loans to minimize the risk of locking in interest rates, while borrowers were equally receptive to floating rates with the hope to refinance at a lower rate once rates dropped to more “normal” levels. The base rate for most floating rate loans used to finance commercial real estate is SOFR (Secured Overnight Financing Rate), which the Federal Reserve adopted in 2020 to replace LIBOR (London Interbank Offered Rate). SOFR was phased in over several months with a full implementation in June 2023. The 1-month SOFR rate jumped roughly 500 basis points from near the peak of market valuations, increasing from 0.5% in March 2022 to a high of 5.4% in late December 2023. Lender spreads also have widened from a range of 150 to 250 basis points in March 2022 to 200 to 300 bps in December 2023. The following table illustrates the dramatic impact of the increasing base SOFR rate on mortgage rates.
Since equity returns represent the highest risk in the capital stack, they should exceed returns for the mortgage position. Accordingly, property capitalization rates that are used to capitalize a property’s stabilized NOI (net operating income) typically exceed the mortgage constant (principal amortization plus interest). This relationship is obvious since the capitalization rate is comprised of a blend of the higher equity returns with lower debt returns, creating positive leverage. There is one caveat to this stated equity-debt relationship that is incumbent in the capitalization rate calculation, which is that the equity return (i.e. equity dividend rate) implicitly includes the expected appreciation, so that if considerable upside is expected in NOI, the equity dividend rate can be similar to or below the debt component of the capitalization rate. For an investor to accept a lower equity dividend rate than the mortgage constant, property appreciation would need to increase the equity yield over the holding period above the mortgage yield, creating positive leverage.
The circumstance of an equity dividend rate below the mortgage constant has been evident in some recent transactions, resulting in capitalization rates below prevailing mortgage rates. In spite of instances of some buyers underwriting equity dividend rates below the mortgage constant in these transactions, most transactions have had capitalization rates above those prevailing during the low interest rate period of 2021 and early 2022.
Sentiment remains decidedly mixed on whether interest rates will drop in the near term, remain where they are, or potentially even move higher over the next 12 months. If interest rates don’t move lower, it doesn’t bode well for creating a thaw in the transaction market. Though it might appear reasonable that mortgage rates would decline in short order with the Fed seemingly through with rate hikes, increases in perceived risk and slower economic growth may delay mortgage rate declines. For example, 10-year US Treasury Rates declined 100 basis points from mid-October 2023 through year end, while SOFR rates that are the base for many mortgage loans have remained at 5.3%.
Sellers are going to need to be the ones to blink first and recognize that they need to lower their pricing expectations if they want to sell their property. Sellers have been holding their properties in this environment, rather than accept prices below their expectations based on a rear-view mirror reflecting favorable leverage. From the buyer perspective, there may be some upward movement on pricing if buyers feel they can refinance at lower rates sooner than what was anticipated over the past two years.
Capitalization Rates Increase
An illustration of the impact on capitalization rates of increasing mortgage rates between March 2022 and December 2023 can be observed by application of the band-of-investment technique that many appraisers and lenders employ.
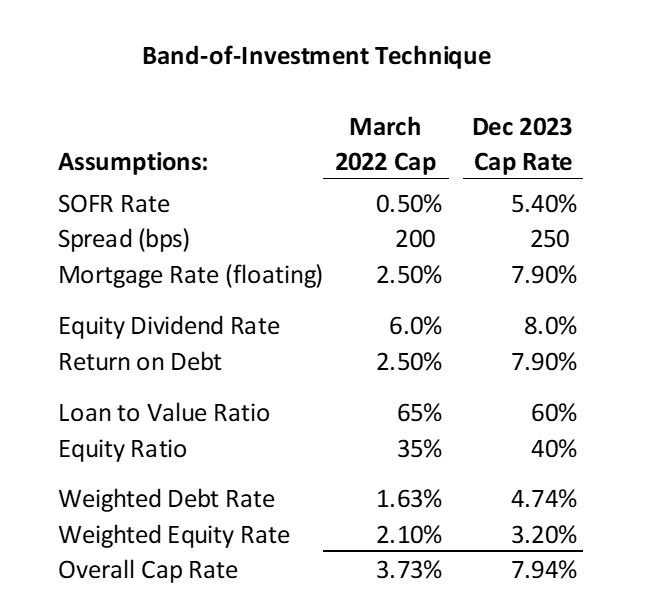
The preceding calculation considers the impact on mortgage rates based on three adjusted variables. The SOFR rate plus the spread provided the mortgage rate component of the calculation. The lending environment in December 2023 exhibited lower loan-to-value ratios and higher equity dividend returns, which both resulted in an increase in the calculated capitalization rate. Many investors required higher equity returns for the capitalized year than 8%, which would result in a calculation of even higher capitalization rates than shown in this calculation. One factor that must be considered is that most investors expect to refinance once interest rates decline. The foregoing calculations imply equity returns in perpetuity, so a lower equity return in the capitalized year could be acceptable based on refinance expectations. In other words, negative leverage may be present in the single capitalized year, but positive when considered over a longer holding period.
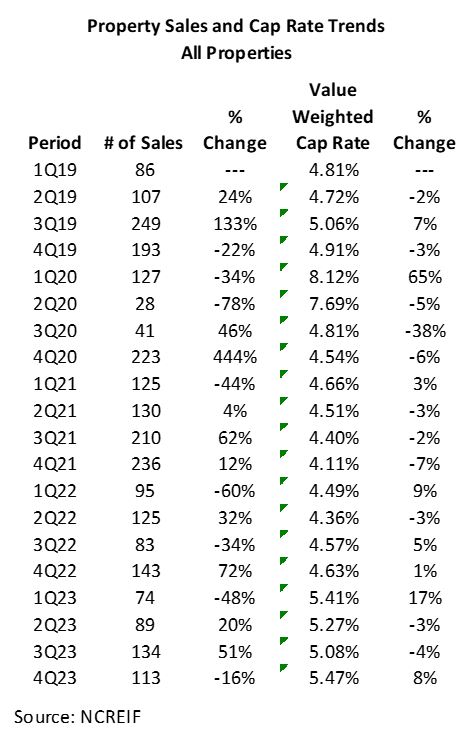
NCREIF is an excellent source of transaction data for the private real estate market, based on its holdings of over 10,000 properties. Properties in the NCREIF index are considered institutional quality, representing many of the highest quality and most desirable properties in the US. This higher end of the market garners the highest prices and lowest returns by a wider gap compared to lower quality properties in the current market than when markets were more liquid. This is due to the “flight to quality” that typically occurs during a down market. Beyond cyclical trends, these institutional quality properties also benefit from physical attributes that include superior environmental, construction quality, and modern technology features. A summary of the quarterly capitalization rate trends from the beginning of 2019 through 2023 presents the trend for all properties.
The following graph illustrates the relationship between mortgage rates and capitalization rates over the past 5 years. While mortgage rates increased rapidly during 2022, capitalization rates also moved upward, albeit at a slower rate. The mortgage rate data is from MSCI, while the capitalization rates are from NCREIF’s transaction database. As will be discussed later in this article, some sources reveal capitalization rates that are higher than NCREIF’s reported rates.
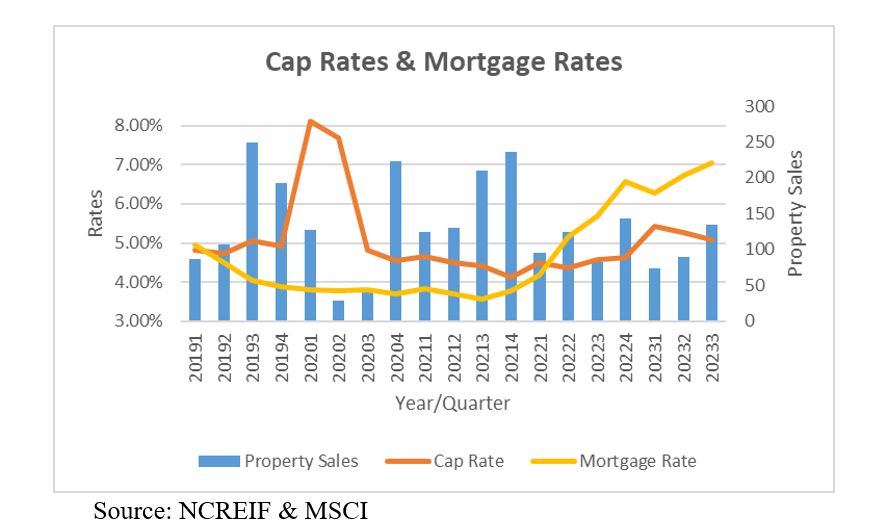
The increase in capitalization rates from the 4.1% low in the fourth quarter of 2021 to 5.1% in the third quarter of 2023 equates to a 19% value decline, given no change in income. This decline is for what can be described as “Class A (or A+)” properties, while lesser quality properties have experienced much larger declines. The table illustrates that the rise in capitalization rates does not fully incorporate the concomitant increase in mortgage rates. Property sales volume from the beginning of 2022 through mid-year 2023 has been between one-third and one-half the volume for the last two quarters of 2021 as sellers have chosen to hold their properties rather than sell for lower prices resulting from higher mortgage rates. Buyers similarly have decreased their appetite based on higher financing costs. Many properties have been placed on the market over the past two years, only to be removed from the market when multiple bids have come in significantly below seller expectations. The pickup in transaction activity the last two quarters offers some hope for increases in market activity going forward.
Rental Rate Growth
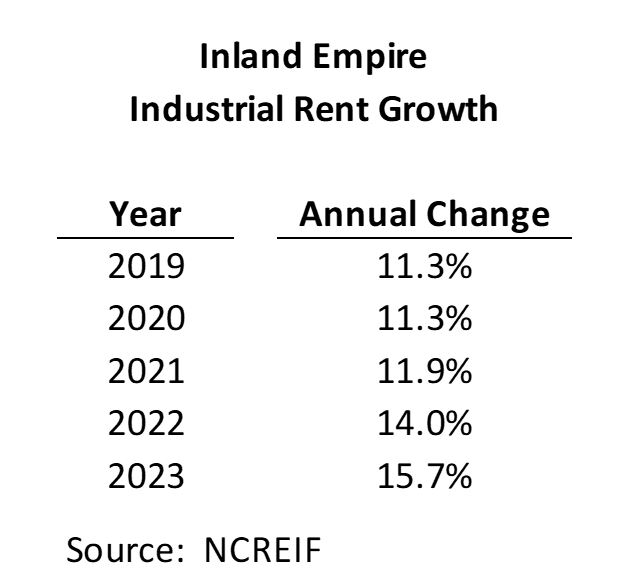
The earlier mention of high rent appreciation in 2021 and much of 2022 supporting lower capitalization rates during those periods deserves some discussion. During the past several years many properties garnered double digit annual rent increases that resulted in capitalization rates approaching or below prevailing mortgage rates based on the implicit growth component of the capitalization rate. An illustration of high rental growth placing downward pressure on capitalization rates is indicated by NCREIF data from over 200 industrial warehouses located in the Inland Empire of California. This area east of Los Angeles experienced high demand with the growth in online shopping and the consumer recovery from the depths of COVID.
The preceding Inland Empire growth rates are considered something of an anomaly, though similar strong rental growth occurred for industrial and apartment properties in many markets. A broader view of over 10,000 US properties shows more extreme rent fluctuations than for the Inland Empire Industrial properties, with apartment and industrial property types leading the 2021 and 2022 recovery.
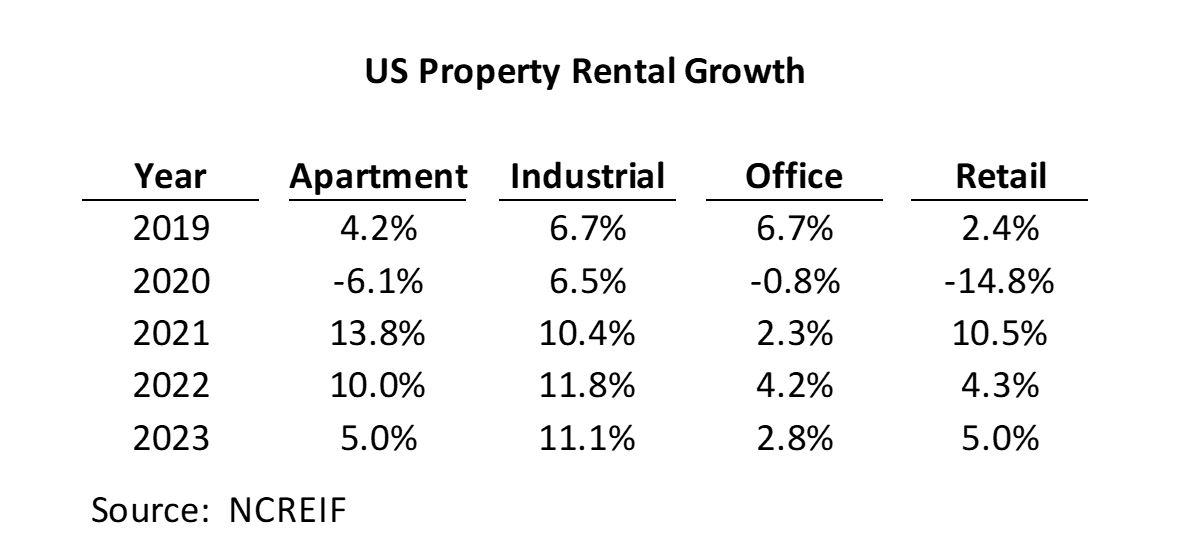
Though industrial properties maintained strong performance through 2023, rents for apartment and office declined from 2022. Retail rent growth remained steady in 2023, though down by half from 2021 levels. Indications are that rental growth in 2024 will slow from 2023 levels. The slower growth expectations along with higher mortgage costs place upward pressure on capitalization rates. The theoretical expression of the relationship between increasing real estate yields and declining growth projections on capitalization rates is exhibited in the formula Yo = Ro + CR a (Yield = Overall Capitalization Rate + annualized change in income and value), which indicates that if yields rise and annualized growth declines, capitalization rates will have to increase.
What Do the Public Markets Tell Us
The private real estate sector can look for clues of how higher lending rates are impacting prices by viewing the more liquid public REIT market. Transparency in the public markets based on constant liquidity offered by buyers and sellers acting on their market perceptions provides superior price discovery to the much less active private real estate markets. Though REITS may occasionally give false signals on expected private market behavior, they do provide an additional datapoint that can be considered in analyzing private market trends.
Though a large part of the delay in pricing movements for the private market can be attributed to the public market’s superior liquidity, another major consideration is the bond-like nature of leased commercial real estate where long term leases soften the impact of cycles since income adjustments to market levels are delayed until lease expiration. One metric Green Street tracks for REIT investors is how the stock is trading relative to the value of the underlying real estate. The underlying real estate is valued internally by Green Street based on analysis of income and capitalization rates for the different property types. If the stock price is higher than the estimated value of the underlying real estate, the stock is noted as trading at a premium to net asset value (often abbreviated to “Premium to NAV”). If underlying NAV is greater than the capitalized value of the stock the premium is noted as negative, and the expectation is that the underlying value of the real estate will decline. Typically, the stock should trade at a premium to NAV based on increased liquidity and diversification than offered by the individual properties. Below are the year-end 2023 metrics for the major property types.
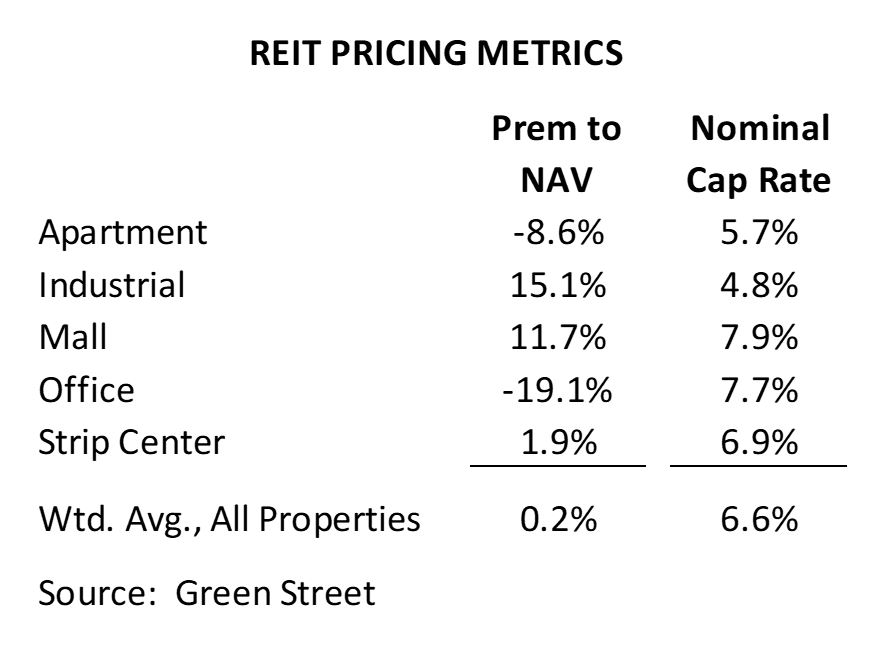
The foregoing REIT metrics suggest that Apartment and Office categories are over-valued, while Industrial and Malls may have some upside. The other retail category, Strip Centers, suggests the underlying real estate may be slightly over-valued since the margin for the liquidity of the public market is relatively thin at 1.9%.
The following table illustrates comparative price trends between the public real estate (NAREIT) and the private real estate market transactions (MSCI) by property type.
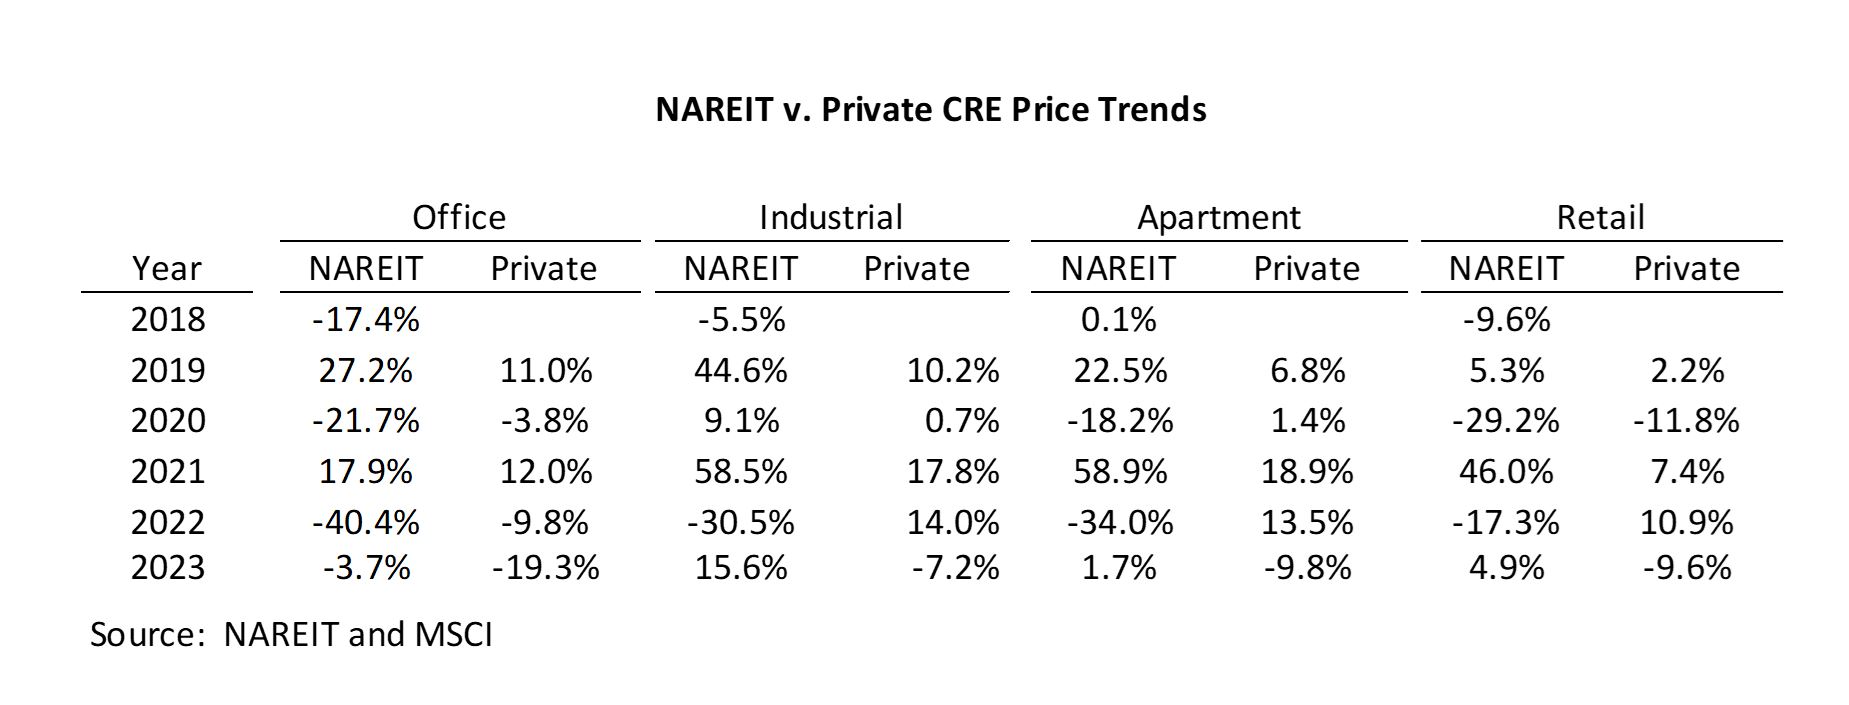
The REIT pricing indicators are considered to reveal pricing trends around 6 months prior to recognition of similar pricing trends in private real estate. An observation from the preceding table is that the public real estate markets (NAREIT) tend to exhibit more volatility than the private real estate markets. Previous studies have supported the higher standard deviation for the public v. private real estate market prices. The former is more susceptible to emotional responses based on greater liquidity allowing immediate execution of a transaction, while the longer marketing period for private real estate tends to smooth out such emotional responses.
It is apparent from the preceding table that the 2023 private market declines for each property type are trailing the larger NAREIT declines in 2022. A potential upward turn in the private market at some point in 2024 is suggested by the positive 2023 NAREIT returns for the noted property types (excluding office). Among the caveats of reliance on public market trends to suggest forthcoming private market trends is that the public markets were more susceptible to generally positive economic news occurring during 2023, so another few periods of positive public returns may more strongly suggest a private market turnaround.
Values vs. Valuations
Much of the institutional real estate investment community relies upon independent valuations by appraisers to provide market value estimates to ensure that investors in these funds have an accurate understanding of the value of their holdings. Further, government regulations and internal policies require independent valuations of real estate assets held by many funds. Valuations are performed by both external and internal parties in order to “mark to market” properties held by investors. Whether in the form of appraisals performed independently under industry regulations and guidelines or internally in a less regulated environment, the valuation process is often defined as somewhere between an art and a science. When plentiful transaction data is available valuations becomes more of a quantifiable science, but in a low transaction (or overly volatile) environment valuations take on the more subjective character of art. Investigation of appraisal-based valuations compared to actual transactions reveals some insight into the alignment of these subjective and quantifiable processes.
This paper has previously presented analyses of available transactions and indirect value indicators, including interest rates and volume of property sales, which support value declines. To ascertain how valuations align with transactions NCREIF offers a database that includes appraisals on assets held by the member owned or managed funds as well as transactions of properties involving these funds. The database tracks capitalization rates for both sales and appraisals. Properties in commingled accounts (those with multiple investors) are valued quarterly, providing regular updates on valuations and related assumptions. The following table exhibits capitalization rates from prior to the peak (4th Quarter 2021) through the end of 2023.
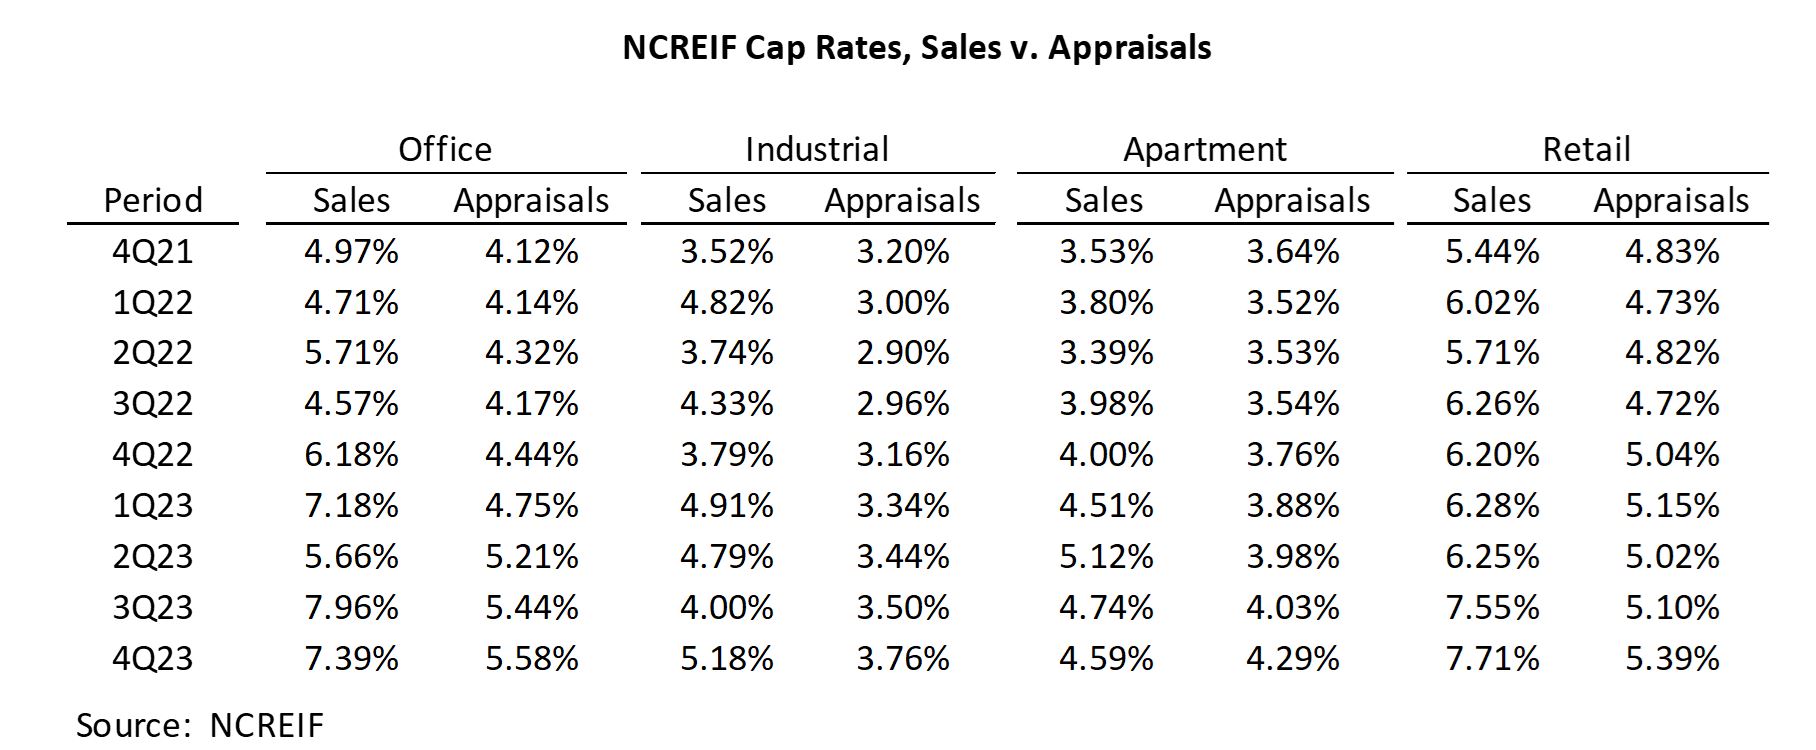
Appraisals have included capitalization rates that have been consistently more aggressive than those indicated by transactions, with the spreads widening noticeably in the last half of 2022. The exception was apartment appraisals, which exhibited reasonably narrow spreads to transactions until 1Q23. In this quarter, apartment appraisals lagged transaction capitalization rates by 63 bps. Appraisers lagged market transactions by the largest margin in the structurally challenged office market, falling below transaction-based capitalization rates in 2Q22 by 139 bps, with an even wider gap in more recent quarters.
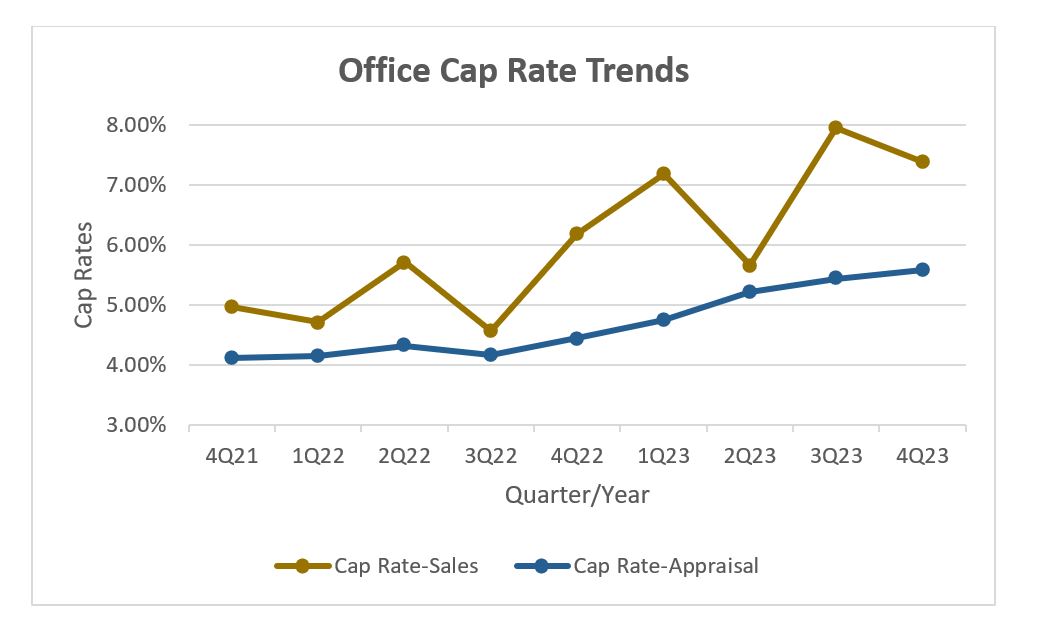
A graph comparing office capitalization rate trends from both appraisals and actual transactions illustrates that appraisals tended to produce a relatively smoothed performance, while transactions experienced much wider variances. By trending upward at a much slower pace than transactions, appraisals lagged progressively further behind. The spread between these two indicators increased from 40 bps in 3Q22 to 181 bps by 4Q23.
The previously described limited quantity of transactions were partially to blame for the failure of appraisers to support significant value declines. However, by considering other indicators related to value, such as dropping transaction volume and higher financing costs, it appears likely that lower valuations should have been concluded. The following table presents a summary of transaction volume during the aforementioned period.
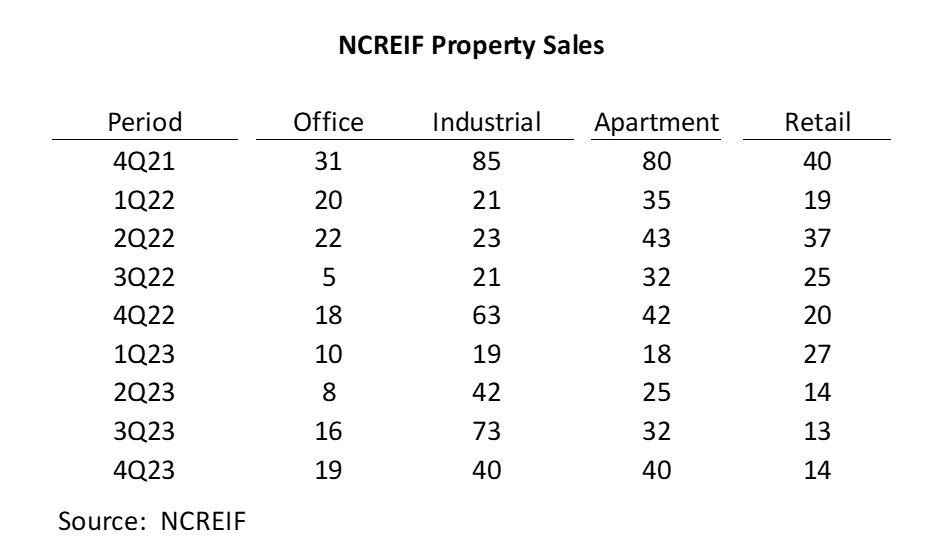
The least transparent market was for office transactions, which only totaled 5 in the entire US involving NCREIF funds in 3Q22, leading appraisers to rely upon older sales and other non-transaction data. Over-reliance on older transactions was a flawed premise since appraisers failed, in many instances, to adjust these older sales adequately for higher interest rates. Commercial mortgage rates increased from 3.7% in 4Q21 to 5.7% by the end of 3Q22. By comparison, capitalization rates for office appraisals only increased from 4.1% to 4.2% during this same period. Valuers had the tools in their toolbox to value properties in a market with limited sales, but most failed to adequately consider other data. These indicators included the band-of-investment (mortgage-equity analysis), bids on properties that were pulled off the market when sellers were unwilling to sell at that price, property listings, and feedback from brokers. Though some may argue that they did adequately consider these factors, the spread between transactions and appraisals produced by the NCREIF database comes to a different conclusion.
Green Street also performs internal valuations for the assets that comprise the REIT portfolios. Though these valuations may not meet all requirements of an appraisal conforming with USPAP (Uniform Standards of Appraisal Practice), a similar process of capitalizing net income by market-based capitalization rates is undertaken (many appraisals additionally utilize a discounted cash flow analysis). For sake of comparison, both methods will be termed “appraisal-based” in this article. Based on Green Street’s index, known as CPPI (Commercial Property Price Index), an aggregate of all property values dropped 22% from a March 2022 peak through December 2023. NCREIF valuation declines peaked about 3 months later than those estimated for Green Street. This was possibly due to what many define as appraisal lag, whereby appraisers looking backward for transactions and in a cyclical market often trail actual value swings. As a result, all NCREIF property types addressed below peaked in 2Q22. NCREIF’s appraisal-based valuations reported a 14.5% decline for that period.
A summary of the value changes reported by property type by both NCREIF and Green Street from their respective peaks to troughs are presented in the following table.
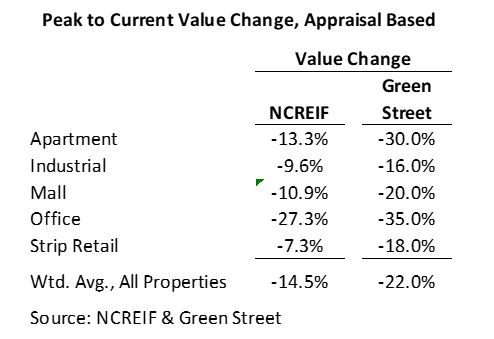
NCREIF’s appraisal-based index has reported lower declines for most property types, with apartment, mall, and strip retail showing the most extreme variances to Green Street’s estimates. NCREIF appraised values began to show value declines in 3Q22 for all of these property types. The earlier data on rent growth showed declining rental growth for apartment and office in 2023 that was about half of the prior year’s growth, with these lower growth expectations having a negative impact on values. Industrial maintained its double-digit rental growth in 2023, though expectations for a slowdown in this trajectory in 2024 will result in value declines based on more conservative cash flow assumptions. Retail was the one category that exhibited rental growth in 2023 over the prior year, though the increase was marginal.
NCREIF mall and strip retail values declined 10% to 7.3% from their 2Q22 peaks, while Green Street values for these property sectors were down 20% to 18% from their peak. It is important to note that additional value losses in this property sector occurred prior to the noted peaks due to a more severe impact from COVID. The 2020 downturn in retail values was reported by Green Street at 28% for malls and 12.8% for strip retails, while NCREIF reported declines of 12.9% and 6.5%, respectively.
Office has experienced the most significant drop in value according to Green Street, down 35% from the peak, with structural changes due to remote work adversely impacting demand. Values for all property types are down 3 percentage points from CPPI’s November data. This indicates that the private market downturn in values has continued, contrary to the public markets (NAREIT) that revealed 2023 increases in value, with the exception of the reeling office sector.
The most material differences in value declines between the NCREIF and Green Street were for apartment, mall, and strip retail properties. The primary variables that impacted these differences were investment rates (capitalization rates, terminal capitalization rates, and discount rates), income estimates, and income growth. Capitalization rates from both organizations were compared to transactions included in both NCREIF’s and MSCI’s databases to help identify the differences. Based on the larger size of the MSCI database and the reported rates, it appears to include a broader range of quality among its properties, thereby representing some that lie below the institutional grade comprising the NCREIF and Green Street databases.
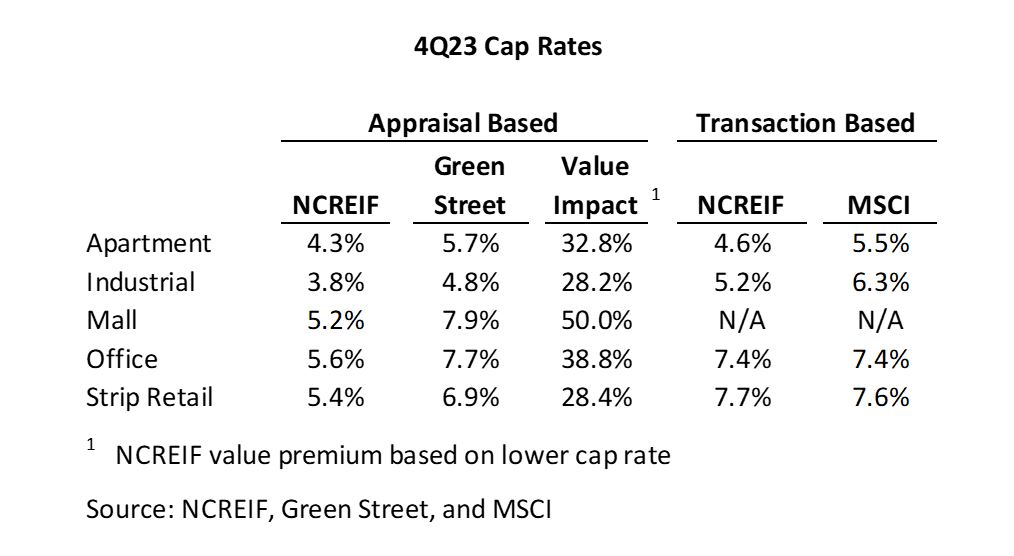
The preceding data suggests that Green Street’s internal capitalization rate estimates were more similar to transactions in 4Q23 for industrial, office and strip retail, when compared to NCREIF’s appraisal-based estimates. No mall transactions were included in the database. NCREIF appraisals were closer to apartment capitalization rates from their own transaction database, with apartments at the lowest rates of all noted property types. Conversely, Green Street apartment capitalization rate estimates aligned more closely with MSCI data.
The “Value Impact” column calculates the variation in value if net operating income remains constant and only the capitalization rate from the two appraisal-based estimates is considered. The resulting NCREIF values would be 28% to 50% above the Green Street values based on this assumption. A conclusion that NCREIF’s appraisals lagged the market appears supported by the transactions, though the data was limited for strip retail, and to a lesser degree, office.
The Elusive Nature of Price Discovery
It has been undeniable that the trend of substantially increasing interest rates has had a negative impact on market value. Rising interest rates also led to limited transactions with the values negatively impacted by the seller’s inability to achieve their exit pricing expectations. Although the value impact of rising interest rates can be addressed in a formulaic context through such methods as mortgage-equity calculations, analysis of actual transactions is the true litmus test to determine value trends. The following table illustrates that 2023 was 16% below the previous low point of transaction volume experienced in 2020, when Covid disrupted the US economy.
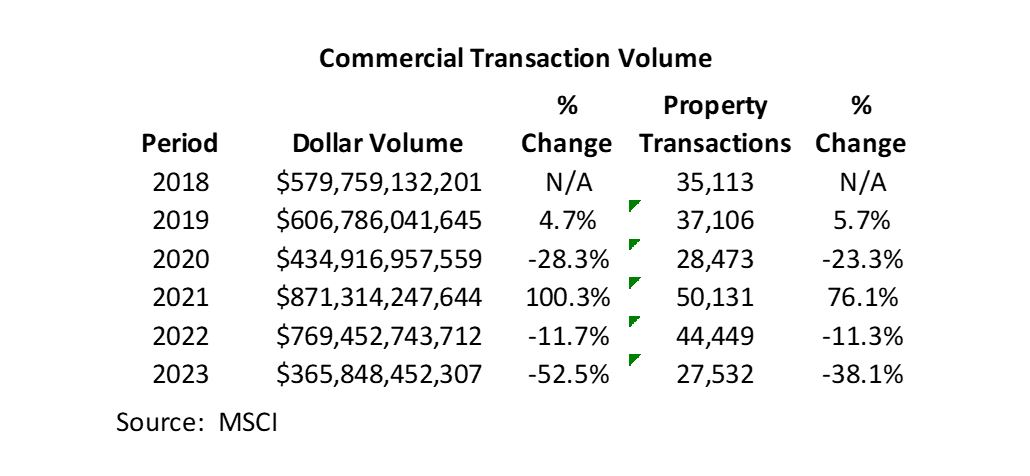
Increasing interest rates in 2022 lowered the prices that buyers were willing to pay as debt service commanded a greater share of cash flow. In many cases sellers were unwilling, or unable, to meet the buyer’s pricing, reducing transactions. This divergence, known as the bid-ask spread, led to a material drop in transactions in 2022 and an even greater decline in 2023. The property sales dollar-based volume in 2023 declined along with the average property sale price, which declined to $13.3 million from $17.3 million in 2022. Rising interest rates and stricter underwriting made larger deals more difficult to execute, shifting the market to smaller average sale prices. A more detailed view of quarterly activity for all properties since the beginning of 2022 illustrates more pointedly that the downtrend in transactions began in mid-year 2022.
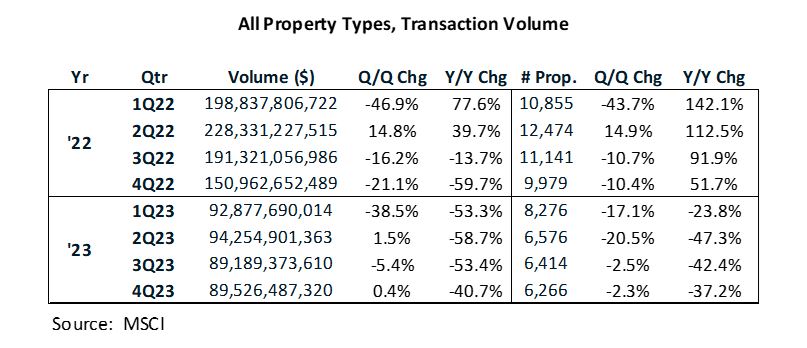
The decline in transaction volume and property sales in 1Q22 is somewhat misleading due to a robust 4Q21 that resulted in the highest quarterly volume over the past 20 years. A more telling view of the 1Q22 performance is noted by comparing to the same quarter of 2021, which it surpassed by 78%. Dollar volume flatlined on a quarterly basis during 2023, though property sales declined materially after the first quarter.
Looking at the core property types, office and apartment transactions have suffered the most in 2023 compared to 2022, with dollar volume declines of 56% and 62%, respectively. Though similar in the rate of decline for these property types during this defined period, the drivers of the trends are quite different. Office has faced structural challenges with remote work and increased obsolescence for older buildings lacking amenities and favorable environmental attributes. The apartment trends appear largely cyclical based on declining capital market conditions, and to some degree, overbuilding.
Transactional dollar volume began declining for all properties in 3Q22 as the federal funds rate accelerated to over 3% (from near 0% at the beginning of the year) and 10-year US Treasury rates approached their peak. Office showed the first signs of weakening trends with 2022 transaction volume ($117 billion) materially below 2021-dollar volume ($148.3 billion). Apartments were still trending strongly through the first three quarters of 2022, increasing 31% over the comparable 2021 period, before imploding in 4Q22 with a 68% decline from the same quarter of 2021, and a 32% decline from the prior quarter. The 3Q22 YTD performance for apartments was even more impressive when considering it followed a heady 141% annual dollar volume increase from 2020 to 2021.
The trend of reduced transaction volume was a reasonable reaction to higher lending rates. Two-plus years of sub-4% commercial mortgage rates (October 2019-February 2022 according to MSCI data) resulted in buyers paying escalating prices for real estate based on favorable leverage and improving overall market conditions, conditions that no longer exist.
The effect of declining transaction dollar volume and property sales is indicative of declining property values. The causal impact of higher financing costs and post-COVID economic factors precipitated these declines, with the structural change in office demand accentuating the headwinds for that property sector. In answering the question as to whether commercial real estate prices have reached bottom, some positives can be taken from transaction volume and property sales trends that slowed their decline in the last half of 2023. It suggests that the light at the end of the tunnel may lead to a brighter future, rather than early 2023’s view that it was an oncoming train.
Where Do We Go From Here?
After viewing trends in mortgage rates, transaction volume, and transaction pricing, it is clear that the rate of decline is slowing. What is less clear is how close the commercial real estate market is to the bottom. The answer may be somewhat uneven when considering the different property types.
The macro issue impacting future transaction volume and pricing is focused on interest rates. The Federal Funds rate, 10-year US Treasury, and commercial mortgage lending rates appear to have stabilized near their peak in 4Q23. With no further expected bumps in the Federal Funds rate, the long-awaited cut in rates will be a favorable stimulus to the real estate sector, as well as the general economy. In February 2024 experts projected a 50% probability of a June rate cut but continued positive economic growth may push this rate cut back, and the CRE market’s recovery along with it.
The stabilizing of real estate activity shown by the extensive MSCI database can be considered a positive, with relatively narrow range of $89 to $95 billion in quarterly transactions for all property types in 2023. The volume of property sales also leveled off in the last three quarters of 2023, averaging around 6,400 per quarter. Future improvement in transaction activity will depend upon increasing net income after debt service or reduced prices to attract investors seeking higher yields.
Higher prices for commercial real estate will be a derivative of improved general market conditions. Paramount among these will be a decline in interest rates, as noted previously. The 2022 run-up in interest rates led to value declines for all property types in the private sector in 2023 after robust increases in value in 2021 and 2022, with the exception of office, which declined in 2022 and 2023. The public markets offered some hope that a positive turn of the market was pending, with increases in values for apartment, industrial, and retail share values. Office, once again, trailed the crowd with a 3.7% decline in share pricing in 2023.
John Kenneth Galbraith once was quoted as saying “In economics, the majority is always wrong.” Similar confidence may be appropriate for other fields of forecasting, such as real estate valuation, at least over the past year or so. With that caveat, it is the author’s view based on input from many respected leaders in the real estate industry that the pain of value declines is not over. Transactions from the NCREIF database show capitalization rates increased, with appraisal cap rates progressively trailing transaction cap rates by larger margins after the 2022 interest rate increases. Considering the needed “catch-up” in appraisal cap rates to transactions, interest rates not expected to decline until mid to late 2024 and slower growth expectations, appraisal capitalization rates could be expected to increase in the near term. The medicine to cure real estate’s ills will be rate cuts by the Fed, followed by reciprocal drops in mortgage lending rates. Of course, I could be wrong.